
Figure 4.
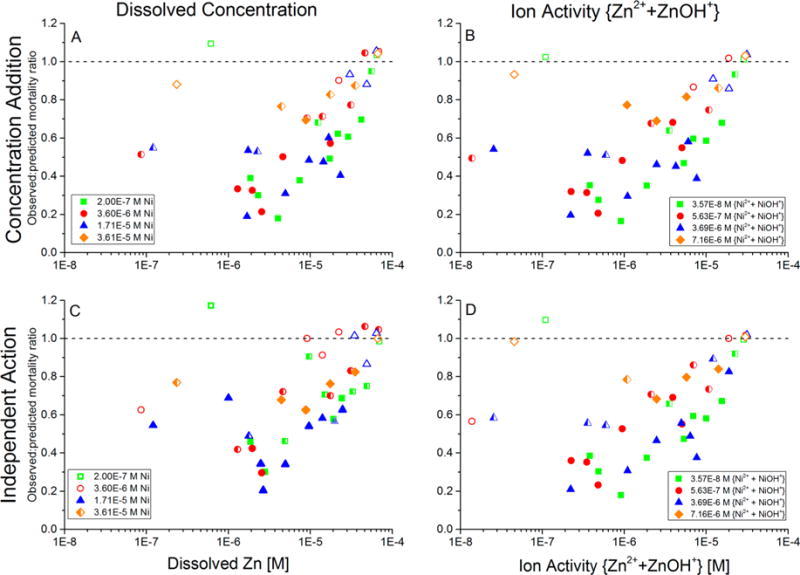
Additivity of toxicity of Cd–Ni–Zn mixtures that contained constant concentrations of Cd 9 × 10⁻⁷ M Cd in all exposure waters) and Ni (separate concentrations in each of the four sets of tests shown in the legend), while Zn was varied along a concentration gradient within each of the four sets of tests. Additivity of toxicity was evaluated by the observed-to-predicted mortality ratio, for which predicted mortality was calculated using either a concentration-addition or independent-action model. (A) CA model with predicted toxicity based on metal concentrations; (B) CA model with predicted toxicity based on ion activities; (C) IA model with predicted toxicity based on metal concentrations; and (D) IA model with predicted toxicity based on ion activities. Each data point is the average of duplicate runs of each combination of metal concentrations. Closed symbols: statistically significant non-additive toxicity (p ≤ 0.05) in both replicate trials; open symbols: not significant non-additive toxicity in both replicate trials; half-filled symbols: significant non-additive toxicity in only one of the two replicate trials. Ratios less than 1 indicate less-than-additive toxicity; ratios greater than 1 indicate more-than-additive toxicity.