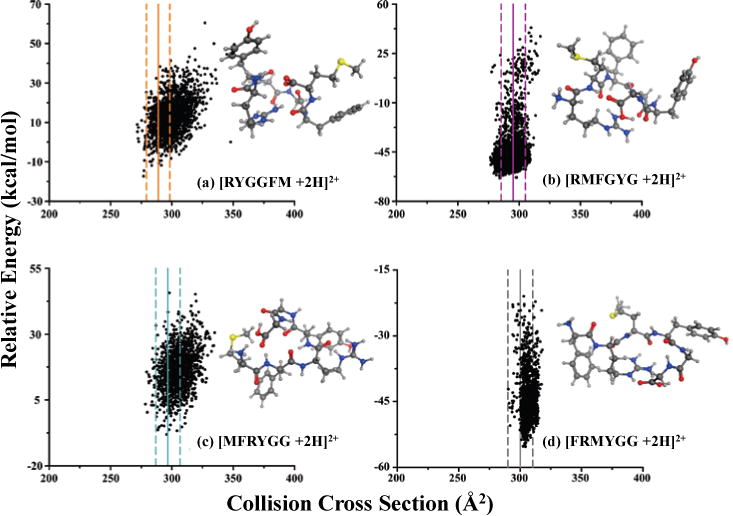
Figure 5.

Computational results for calculating theoretical CCS values of the four enkephalin hexapeptides including (a) [RYGGFM + 2H]2+, (b) [RMFGYG + 2H]2+, (c) [MFRYGG + 2H]2+, and (d) [FRMYGG + 2H]2+. Solid vertical lines on each plot represent the AT-corrected deconvoluted TWIM-MS CCS values and the associated 95% C.L. are indicated with dashed lines; line colors match the corresponding deconvoluted IM profiles for hexapeptides in Figure 4. RMSD clustering representative conformations for each isomer are also included. Yellow, red, blue, gray, and white balls represent sulfur, oxygen, nitrogen, carbon, and hydrogen atoms, respectively.
