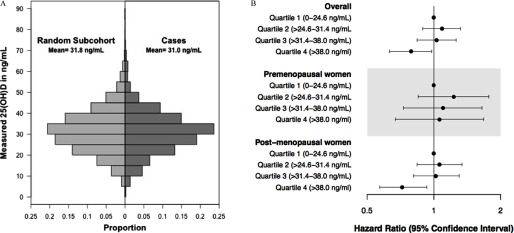
Figure 1.
Distribution of 25(OH)D in cases and random subcohort (A). Hazard ratios and 95% confidence intervals for the association between 25(OH)D and breast cancer incidence within 5 y in the Sister Study (B). The hazard ratios are adjusted for batch, seasonal trends, race, education level, current hormonal birth control use, current hormone therapy use and type, menopausal status, physical activity, body mass index (BMI), osteoporosis, and a BMI × menopausal status interaction term. There are 1,600 cases and 1,822 participants in the random subcohort (including 67 cases) with complete covariate information (total ).

