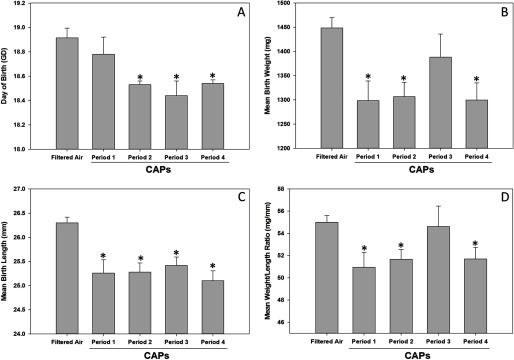
Figure 4.
Maternal exposure to inhaled CAPs during different periods of pregnancy in experiment 3 as described in “Methods” are associated with PTB (A), LBW (B), decreased CRL (C) and decreased SGA (D). The results from analysis of variance (ANOVA) showed significant differences () among the groups for each end point; ANOVA was followed by Fisher’s Least Significant Difference (LSD) post hoc testing to determine differences compared with FA. Data are the from dams for CAPs-exposed mice during periods 1 – 4. Because no differences were observed among the four periods for FA control values, the values were pooled (). Note: CAPs, concentrated ambient (fine-sized particulate matter); CRL, crown-to-rump length; FA, filtered air; LBW, low birth weight; PTB, preterm birth; SGA, size for gestational age. * compared with FA dams based on post hoc testing.

