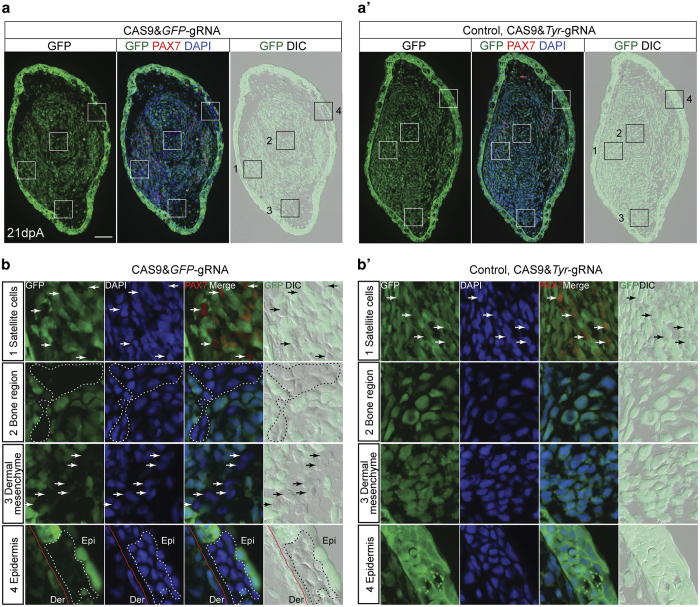
Figure 5.
GFP knockout in other cell types in the axolotl through CAS9–gRNA complex electroporation. (a and a′) GFP fluorescence (green), PAX7 immunofluorescence (red), DAPI (blue) and DIC images of cross-sections from 21-day regenerating limb treated with CAS9&GFP–gRNAs (a) and CAS9&Tyr-gRNA (control, a′). Boxed areas (number 1–4 in a and a′) are shown at higher magnification in b and b′. Scale bar, 200 μm. (b and b′) Images show the loss of GFP expression in a subpopulation of satellite cells identified by PAX7 staining (first row, arrows), as well as the cells at bone region (second row, dotted line area), dermal mesenchyme (third row, arrows) and epidermis (fourth row, dotted line area), which were identified based on the cell morphology and location, in the limbs treated with CAS9&GFP–gRNAs (b) compared with the control (b′). Red lines indicate the location of basal lamina that separates the epidermis (Epi) from the Dermis (Der).

