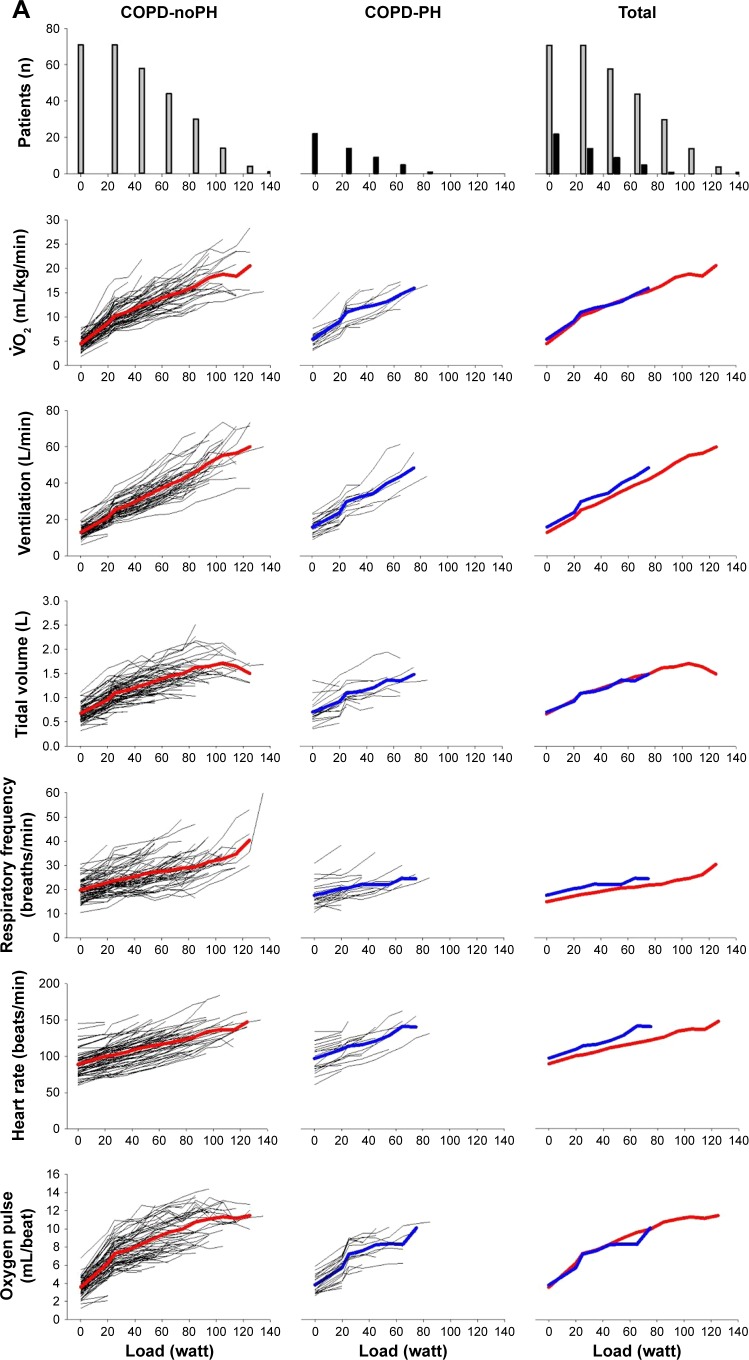
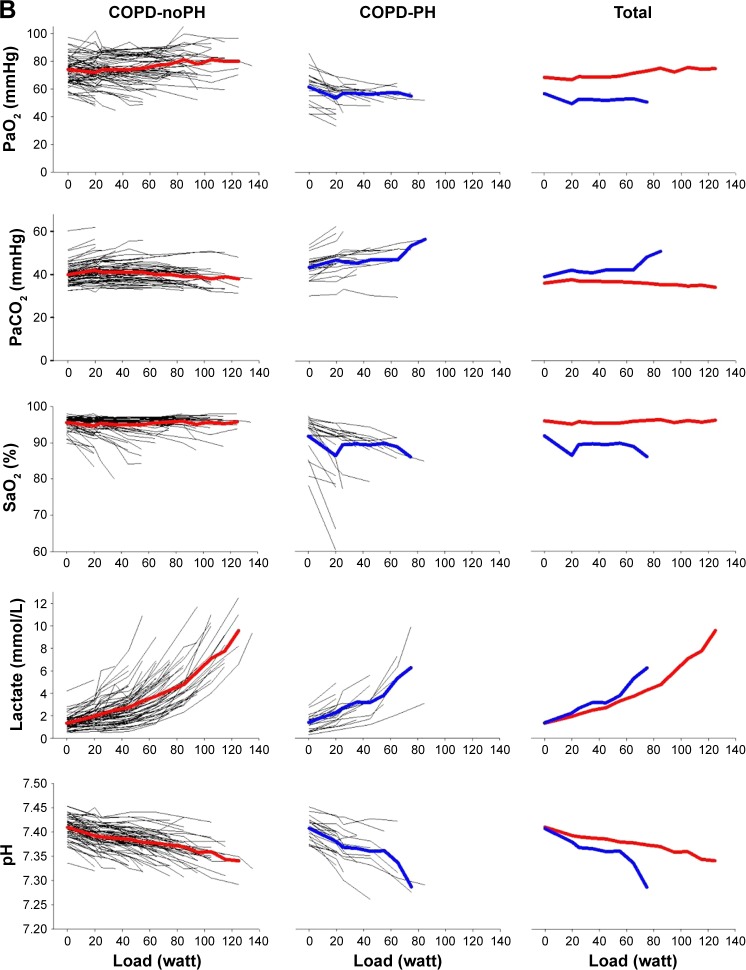
Figure 1.
(A) First horizontal panel shows the number of patients who have been able to exercise at a certain load; left section shows subjects without pulmonary hypertension; middle section shows subjects with pulmonary hypertension and right section shows all subjects. The next panels show the development of variables during exercise for each subject, as well as the mean values for COPD-noPH represented by red lines and mean values for COPD-PH represented by blue lines. (B) Development of arterial blood gases during exercise. With increasing load, fewer patients are represented in the presentation of the mean.
Abbreviations: COPD, chronic obstructive pulmonary disease; PaCO2, arterial carbon dioxide tension; PaO2, arterial oxygen tension; PH, pulmonary hypertension; SaO2, oxygen saturation; , oxygen uptake.


