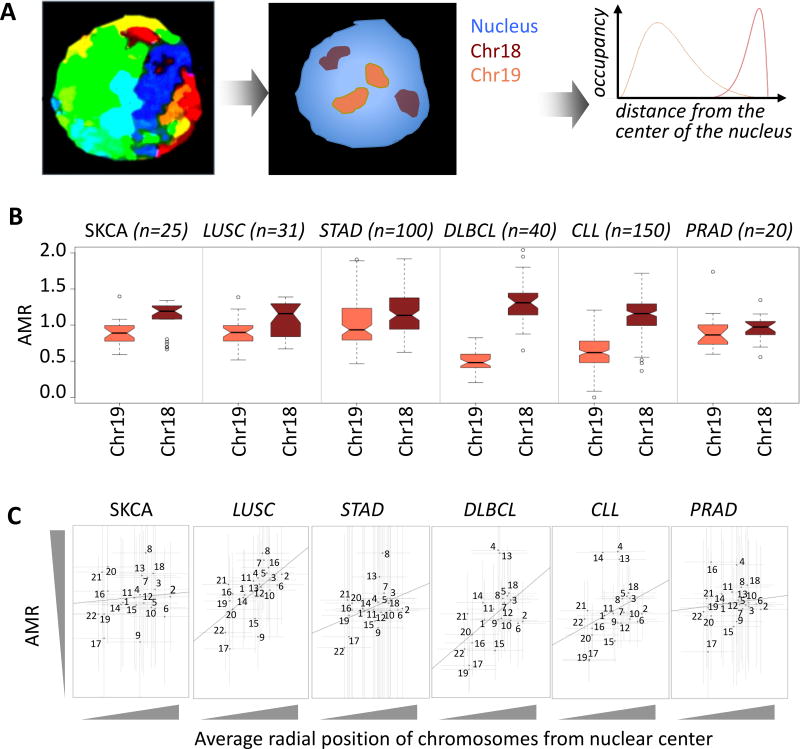
Figure 1. Somatic mutation frequencies differ between chromosomes that are at the nuclear core versus periphery.
A) Eukaryotic chromosomes occupy different radial positions from the center of the nucleus. Classic examples are human chr18 and chr19, which are located at the nuclear periphery and core, respectively. B) The adjusted mutation rate (AMR) tends to be significantly higher for chr18 relative to that for chr19. Cancer types compared are as follows: melanoma (SKCA, n = 25), lung squamous cell carcinoma (LUSC, n = 31), gastric cancer (STAD, n = 100), diffuse large B cell lymphoma (DLBCL, n = 40), chronic lymphocytic leukemia (CLL, n = 150), and prostate cancer (PRAD, n = 20). Mann Whitney U test p-value < 1e-02 for all cohorts. In the boxplots, upper whisker is defined to be 1.5×IQR more than the third quartile or the maximal value of the adjusted mutation rate (depending on which value is greater) and the lower whisker is defined to be 1.5×IQR lower than the first quartile or the minimum value of the adjusted mutation rate (depending on which value is smaller) respectively, where IQR is the difference between the third quartile and the first quartile, i.e. the box length. C) AMR for chr1 to chr22 is plotted against their average normalized radial distances from the center of the nucleus. Average and standard deviation of normalized radial distances of chromosomes from the center of the nucleus were estimated from 54 measurements, as described in38. The number of samples used for AMR estimation is identical to panel b. Standard deviations of AMR and radial positions are shown with vertical and horizontal error bars, respectively. Coefficient of determination was < 0.1 in all cohorts.

