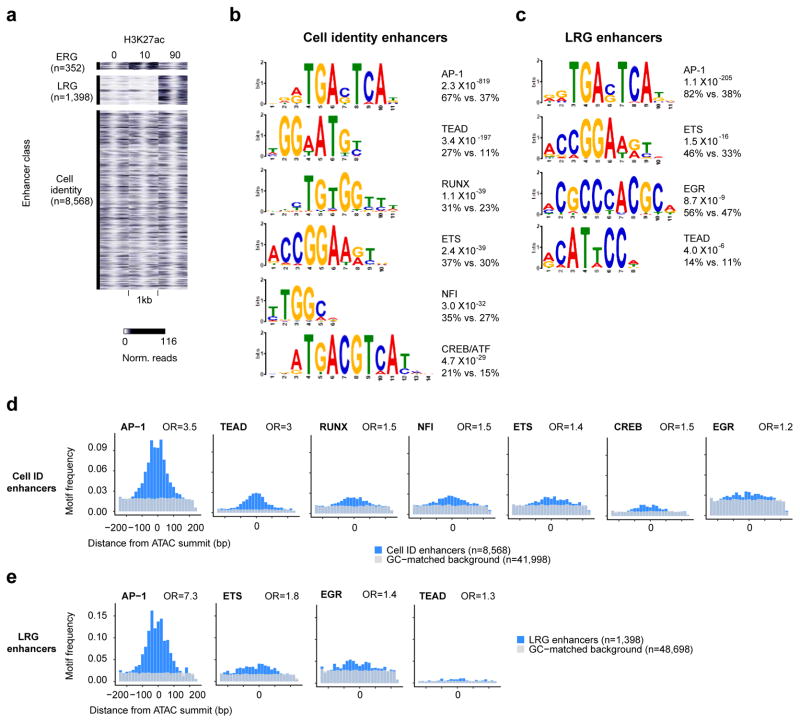
Figure 1. Identification of distinct classes of active enhancers in fibroblasts.
a) H3K27ac ChIP-seq signal (0, 10, 90m of serum stimulation) at distinct classes of enhancers. b,c) Position weight matrices of motifs enriched in cell identity and LRG enhancers. Percentages indicate the fraction of enhancers in each group that contain the motif compared to a GC-matched background set of genomic regions. d,e) Motif frequencies for cell identity and LRG enhancers for motifs identified in (b,c). ORs were calculated for motif occurrences within +/−250bp of the ATAC-seq peak center. P values (chi-square test): Cell identity (<5.3×l0−16), LRG (<5.2×l0−4)

