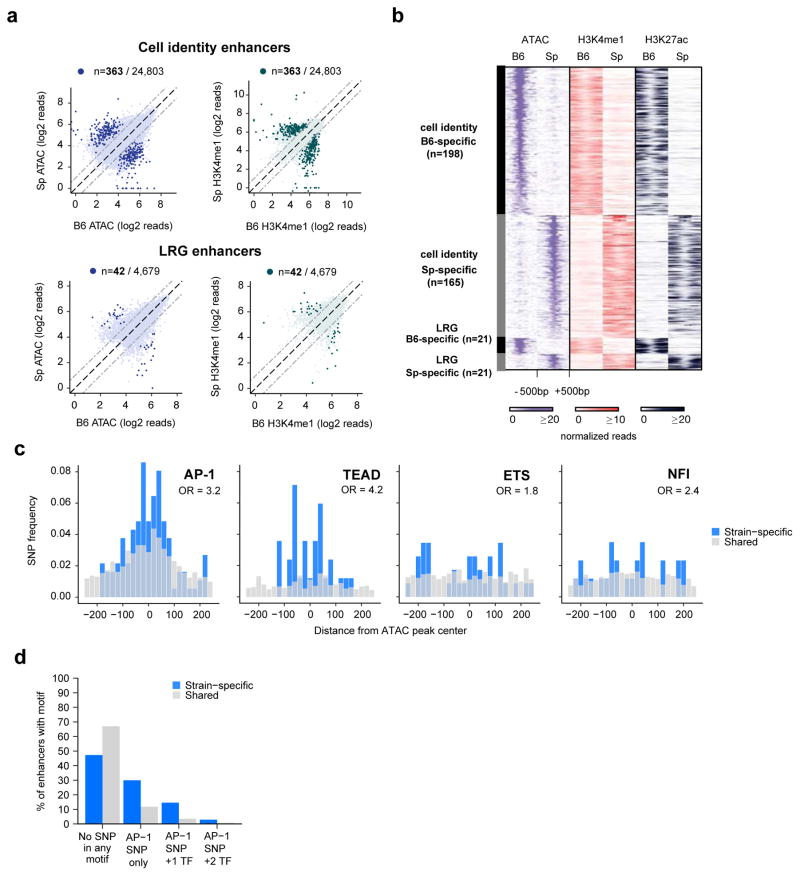
Figure 2. Identification of TF motifs required for cell identity and LRG enhancer selection.
a) ATAC-seq and H3K4me1 ChIP-seq signal from MEFs from C57BI/6J and SPRET/EiJ mice are displayed for cell identity (top row) and LRG (bottom row) enhancers. Highlighted points indicate FDR<10−6. b) ATAC-seq, H3K4me1 ChIP-seq, and H3K27ac ChIP-seq signal from strain-specific enhancers identified in (a), c) Frequency of SNPs that overlap each of the indicated TF motifs. Among the motifs observed to be enriched in Figure 1 at cell identity and LRG enhancers, only SNPs in these motifs exhibited a significantly higher frequency in strain-specific enhancers compared to shared enhancers (by chi-square test), d) Percentages of strain-specific or shared enhancers that do not have SNPs overlapping any enriched TF motif (“No SNP in any motif”), have SNPs overlapping only the AP-1 motif (“AP-1 SNP only”), or have SNPs overlapping both AP-1 and other TF motif(s) within the same enhancer.

