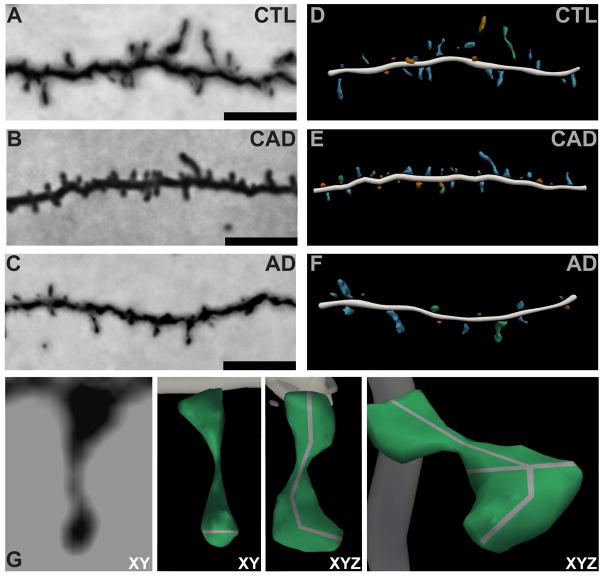
FIGURE 1.
Highly optimized three-dimensional modeling of dendritic spines in controls, CAD, and AD cases. (A, C, E) Representative brightfield images of Golgi-impregnated dendrites. Scale bars represent 5 μm. (B, D, F) Three-dimensional digital reconstructions of the same dendrites generated in Neurolucida360. (G) (Left to Right) Representative zoomed-in brightfield image of a single Golgi-impregnated spine in the XY plane. Three-dimensional digital reconstruction of the spine in the XY plane with a grey line representing the head diameter measurement. Clockwise rotation in XYZ dimensions with a grey line representing the spine extent measurement. Further rotation in XYZ with grey lines representing spine head diameter and extent.

