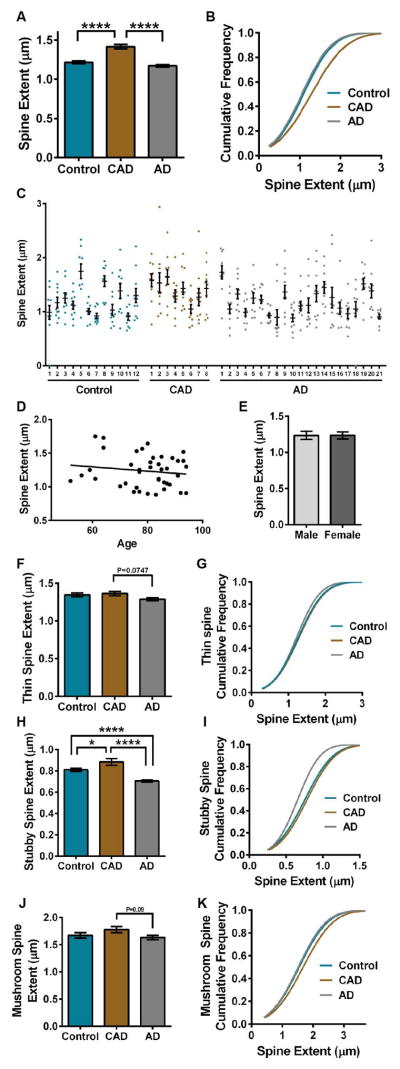
FIGURE 5.
Comparison of dendritic spine extent in controls, CAD, and AD cases. (A) Mean spine extent was increased significantly in CAD compared to controls or AD (ANOVA: P<0.0001; Tukey: controls P<0.0001, AD P<0.0001). (B) The cumulative frequency plots of individual spines indicate that CAD segregates based on spine extent (Kolmogorov-Smirnov: controls D=0.1221, P<0.0001; AD D=1455, P<0.0001). (C) Distribution of spine extent in control, CAD, and AD cases. Each dot represents the average spine extent per individual dendrite that was imaged. (D) Linear regression analysis of spine extent measured across all cases with age. Each dot represents the average spine extent for each individual case. The average spine extent was plotted against the age of each individual. Age represented in years. (E) Average spine extent per individual was graphed based on sex. (F) Mean extent for thin spines was reduced in AD cases compared to CAD (ANOVA: P=0.0486; Tukey: AD P=0.0748). (G) The cumulative distribution of thin spine extent for each disease state was plotted. (H) Mean extent for stubby spines was increased significantly in CAD compared to controls or AD (ANOVA: P<0.0001; Tukey: controls-CAD P=0.0204, controls-AD P<0.0001, CAD-AD P<0.0001). (I) The cumulative distribution of stubby spine extent for each disease state was plotted. The cumulative frequency plots indicated that AD cases segregate from controls and CAD based on stubby spine extent (Kolmogorov-Smirnov: controls D=0.1502, P<0.0001; CAD D=0.2190, P<0.0001). (J) A trending increase in mean extent for mushroom spines was observed in CAD cases compared to controls and AD (ANOVA: P=0.1105; Tukey: AD P=0.0914). (K) The cumulative distribution of mushroom spine extent for each disease state was plotted. The cumulative frequency plots indicated that CAD cases segregate from AD based on mushroom spine extent (Kolmogorov-Smirnov: AD D=0.1165, P=0.0410). Lines represent the mean ± SEM.

