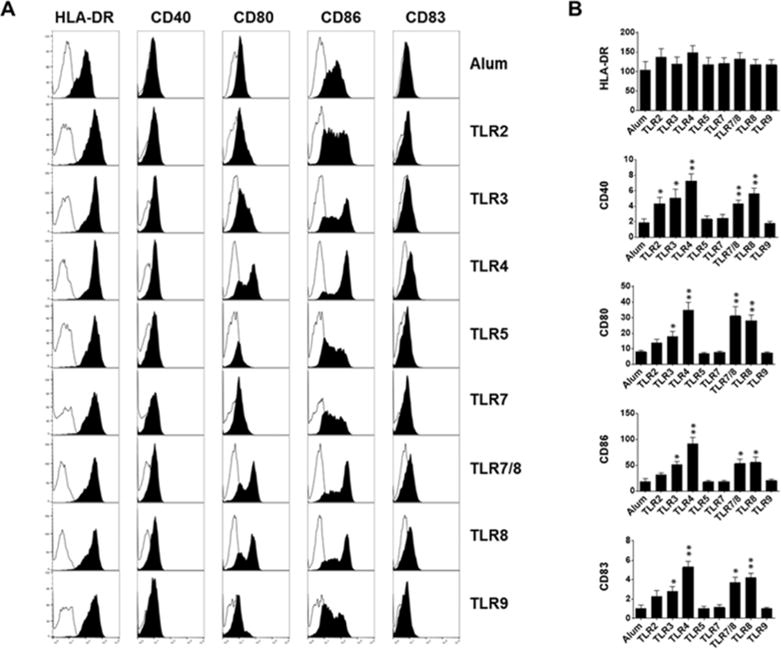
Fig 1.

Immature DCs exposure to aluminum salt or indicated TLR agonists. A) Plots display overlaid histograms of indicated cell surface maturational markers (filled black) and control (filled white) on DCs after 48hr stimulation. One representative flow cytometry data is shown. B) Bar graphs show the geometric mean fluorescence intensity (± SEM) of indicated surface makers expressed on DCs (n=5–12, n denotes number of individual donor-derived MoDCs). * p<0.05, ** p<0.005, relative to Alum.
