
Fig 6.
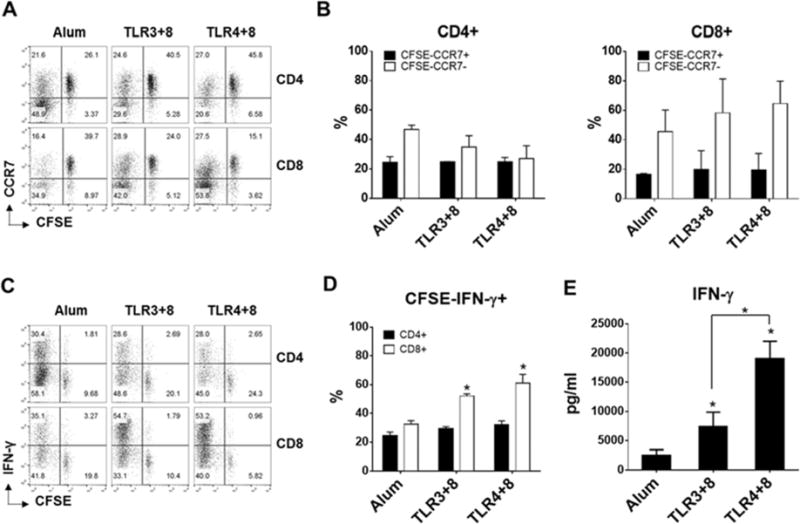
DC, NK, and naïve T cells exposure to aluminum salt or indicated TLR agonists. A–B) Flow plots (A) and bar graphs (B) show the frequency of naïve (CCR7+CFSE+), central memory (CCR7+CFSE−) and effector memory (CCR7−CFSE−) CD4+ and CD8+ T cells generated in the primary co-cultures. C–D) Frequency of IFN-γ producing effector CD4 and CD8 T cells detected within CFSE negative expanded T cells in secondary cultures. E) IFN-γ released in the supernatants of secondary cultures. A–C) One representative flow cytometry data is shown. B–D–E) Data are expressed as mean ± SEM (n=3, n denotes number of individual donors). * p<0.05, relative to Alum. Horizontal bracket denotes the significant difference between indicated samples.