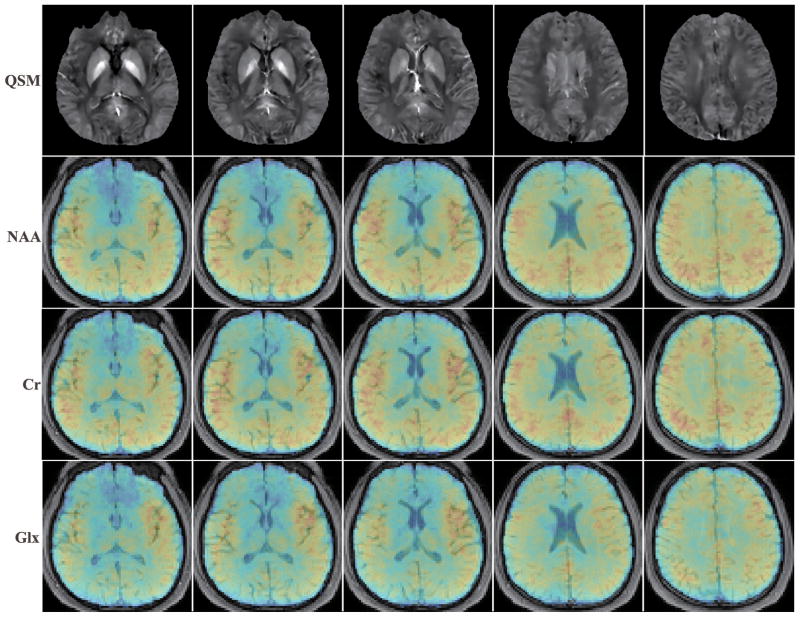
Figure 6.
Quantitative susceptibility and metabolite maps for five representative slices across the brain obtained from a single 7-min SPICE acquisition. From top to bottom they are: susceptibility maps, NAA, Cr, and Glx maps, respectively. The metabolite maps are normalized individually and shown in color overlaid on the anatomical images.

