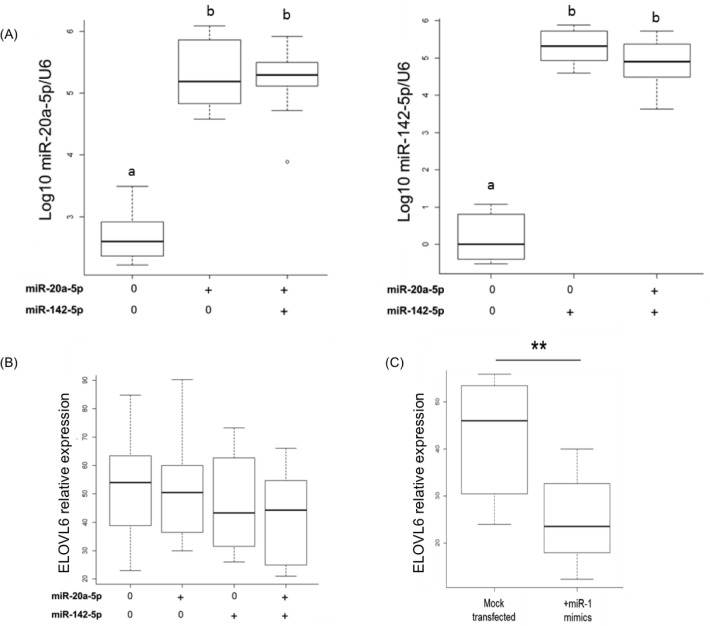
Fig 5. Effect of miR-20a-5p and miR-142-5p over-expression on ELOVL6 expression in BME-UV1 cells.
(A) Levels of miR-20a-5p and miR-142-5p after transfection with miRNA mimics. Data were obtained by RT-qPCR, normalized regarding U6 values and represented as log10. ELOVL6 expression after transfection of miR-20a-5p and miR-142-5p (B) or miR-1-3p (C). Data were obtained by RT-qPCR, and normalized regarding to GAPDH values. Data are the mean of four transfection experiments. a, b:p<0.01; **:0.01<p<0.05, n = 12.

