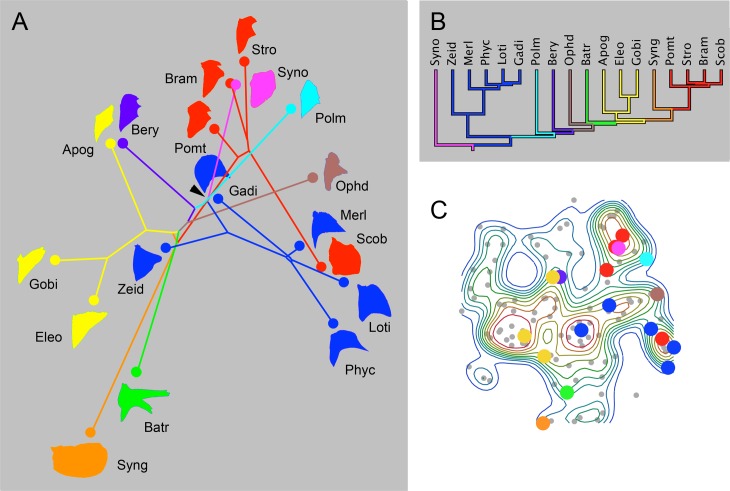
Fig 7. Phylomorphospace analyses reveals extensive evolutionary divergences, as well as apparent convergences among OP shapes in basal acanthomorphs.
A The families included in the plot represent a contiguous paraphyletic grade of Eurypterygian fishes, as shown in the pruned tree in B. Fishes in the sister group to Scombromorpharia (sensu [13]) have been pruned from the tree. Colors facilitate tracing separate lineages, as explained in the text, across the landscape. C The landscape plot (points representing individual families as in Fig 3) shows the distribution of these families (color matched). For explanation of the abbreviations, see text and S1 Table.

