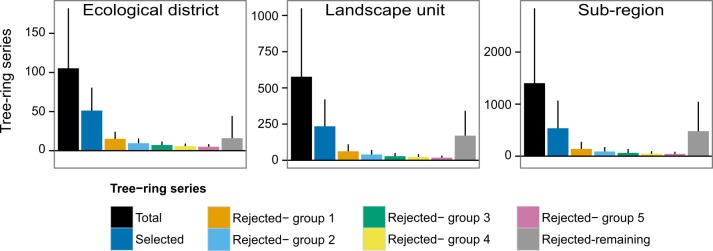
Fig 5. Average number of residual tree-ring series per spatial unit for ecological districts, landscape units, and sub-regions (in black).
In addition to the average number of selected series per spatial unit (deep blue), the figure also displays groups of significantly correlated series when selected series are excluded and the filtering procedure is repeated on remaining data, while the grey bar represents the number of remaining series after five iterations of the filtering procedure. Error bars are standard deviations from the means.

