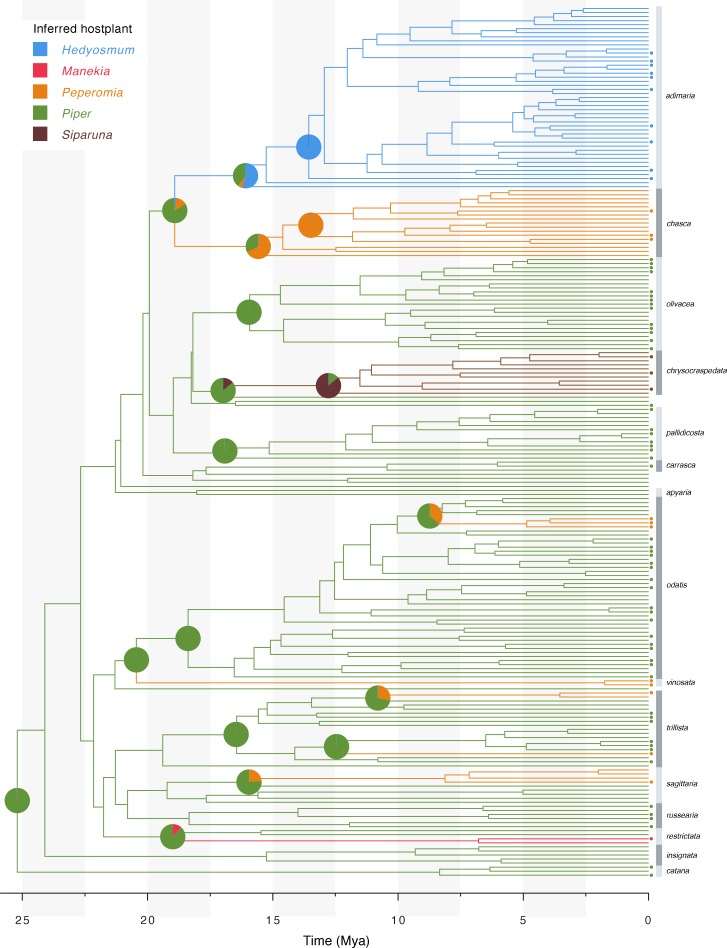
Fig 5. Reconstruction of ancestral host plant use.
Branches are colored according to the most likely state, pie charts displaying the probability of all states were plotted at nodes where shifts in host plant use occurred. Dots next to tips indicate the presence of a host plant record for this particular taxon.

