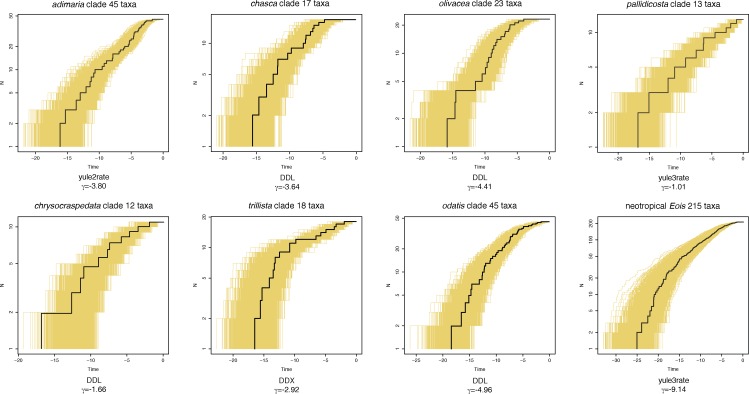
Fig 6. Lineage through time plots.
Lineage through time plots for Neotropical Eois and for all internal clades containing at least 10 species are presented. The entire BEAST tree sample was plotted for each clade, with the plot resulting from the maximum clade credibility tree superimposed (black). Below each chart the respective best evolutionary model and the value of the pertinent gamma statistics are given.

