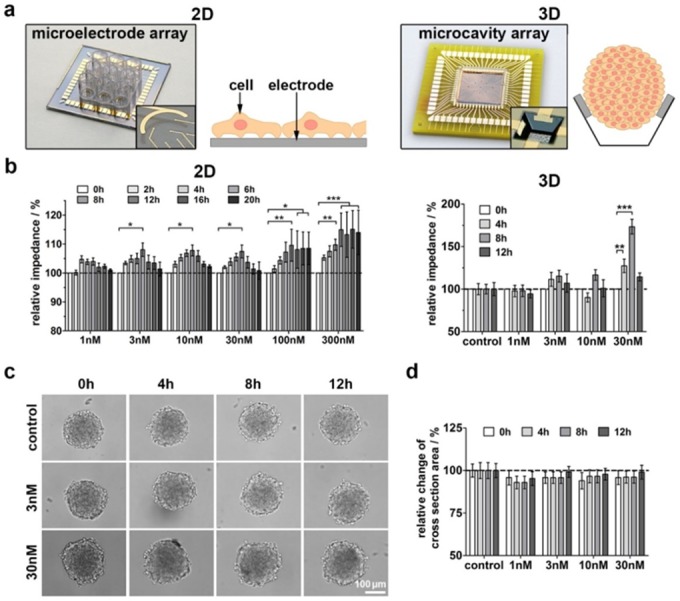
Fig 3. Impedance monitoring of A2M* effects on 2D and 3D cultures of 1321N1 cells.

(a) Microelectrode- and microcavity arrays that were used for monitoring 2D and 3D cultures. (b) Impedimetric analysis for selected time points after application of different concentrations of A2M* to 1321N1 cells in 2D cultures (n = 5) and 3D cultures (n = 10 spheroids). (c) Microscopic images of impedimetrically analysed spheroids upon treatment with A2M* at different time points. (d) Statistical analysis of A2M* effect on the spheroid size, measured as cross section area over experiment time (n = 10 spheroids). All values were normalized to time point zero as well as the control group and are presented as mean ± sem (*P < 0.05, ** P < 0.01, ***P < 0.001).
