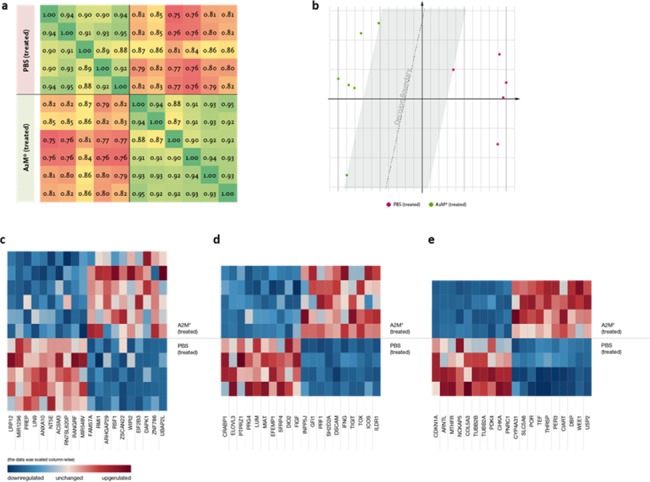
Fig 7. Heat maps of top transcripts modulated by A2M* measured by RNA-seq analysis.

The (a) Pearson Correlation Matrix for all A549 samples using the transcripts with a P-value ≤ 0.05. The matrix resembles the underlying experiment with a r = 0.914 and a Spearman Rank Correlation of 0.978. (b) A MDS was performed, based upon all transcripts with a P-value ≤ 0.05. A clear decision boundary is visible between both groups, without any ambiguity in potential classification. The Scree Plot (not shown) states the trade-off point for potential classification in two dimensions. (c) Effect of A2M* on A549 tumour for the top ten down- and up-regulated transcripts with a P-value of less than 0.01. (d) Top ten down- and up-regulated genes with a P-value of less than 0.01 in xenograft stroma samples in A2M*-treated mice. (e) Top ten down- and up-regulated genes with a P-value of less than 0.01 in livers samples of A2M* treated mice. See also S1–S5 Tables.
