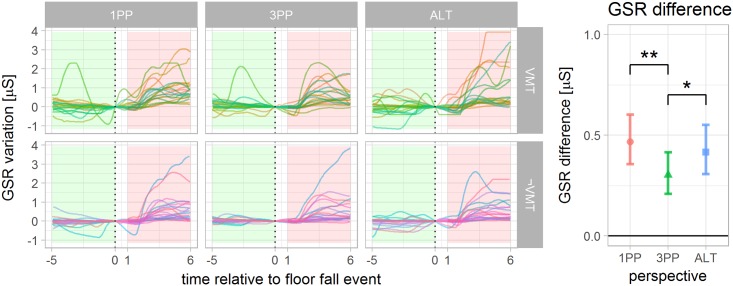
Fig 6. GSR variation time locked to the floor fall event (response in microsiemens).
(left) The green and red shaded areas highlight the time interval used to compute the median GSR preceding (5 to 0 seconds before) and following (1 to 6 seconds after) the floor fall event for each subject. Each line color represents the GSR recording of one subject. The threat caused a statistically significant increase in the GSR response for all 6 combinations of conditions. (right) The difference between the medians is used to indicate the per subject GSR change linked to the threat. A significant difference between 1PP and 3PP was observed.

