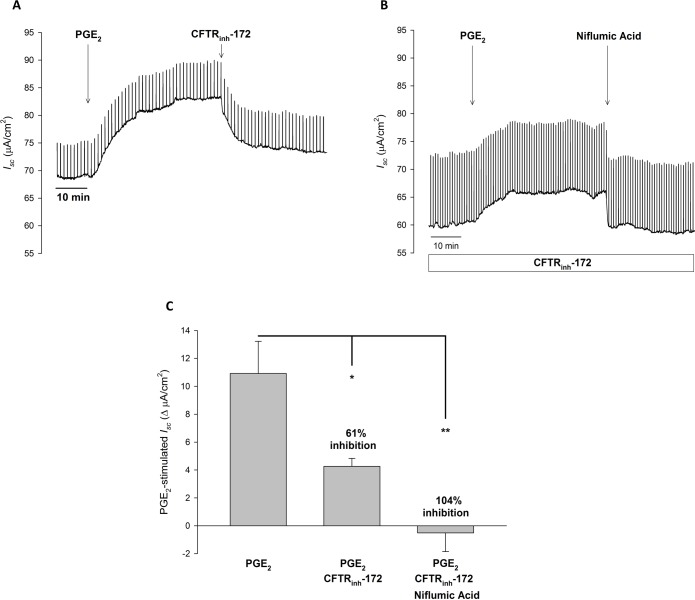
Fig 2. In ferret trachea, PGE2 stimulated Isc is mediated by CFTR and Ca2+-activated Cl- channels.
A. Representative Isc trace with vertical deflections indicating the change in Isc after a 1 mV pulse was applied (every 1 minute). Ferret trachea was exposed to serosal to mucosal Cl- gradient with equivalent bilateral HCO3-. PGE2 (1 μM, serosal) was added to ferret trachea after a baseline period of ≥ 10 minutes, with CFTRinh-172 (20 μM, mucosal) added after 30 minutes. B. Representative Isc trace of ferret trachea incubated in CFTRinh-172 (20 μM, mucosal) for at least 30 minutes prior to PGE2 (1 μM, serosal) stimulation. After 30 minutes, niflumic acid (100 μM, mucosal) was added. C. Change in PGE2-stimulated Isc (mean ± SEM, n ≥ 5) in ferret trachea, with comparisons between no inhibition, CFTR inhibition, or CFTR and Ca2+-activated Cl- inhibition. Asterisks denote significance by Student’s t-test (*, P < 0.05, **, P < 0.01). Mean percent inhibition compared to PGE2 stimulation alone noted.

