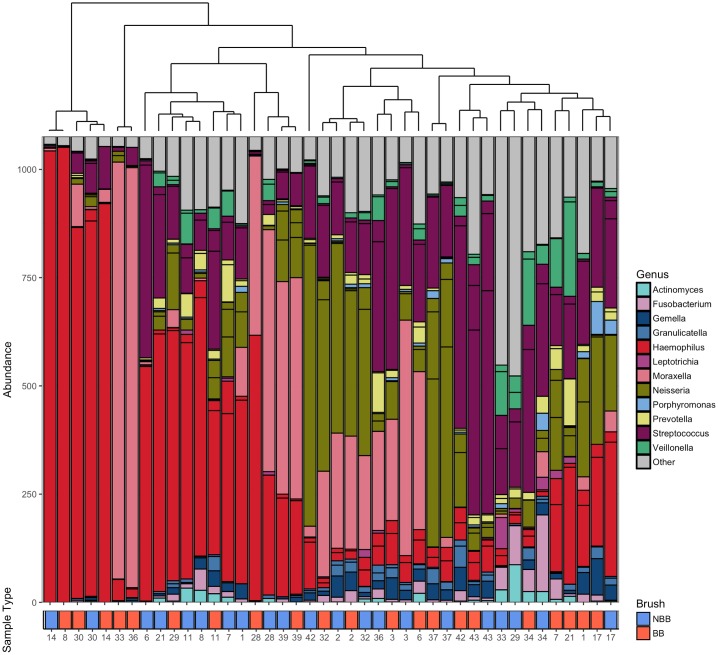
Fig 1. Ordered bar chart of the top 20 OTUs present in both the blind and non-blind brushings.
Samples are ordered by a Bray Curtis dissimilarity hierarchical cluster shown by the top plot. Key to colours used for each genus is included. Identical patient numbers indicate samples were taken from the same individual. Sample type is indicated in the labelling beneath the graph with red indicating blind brush and blue indicating non-blind brush.

