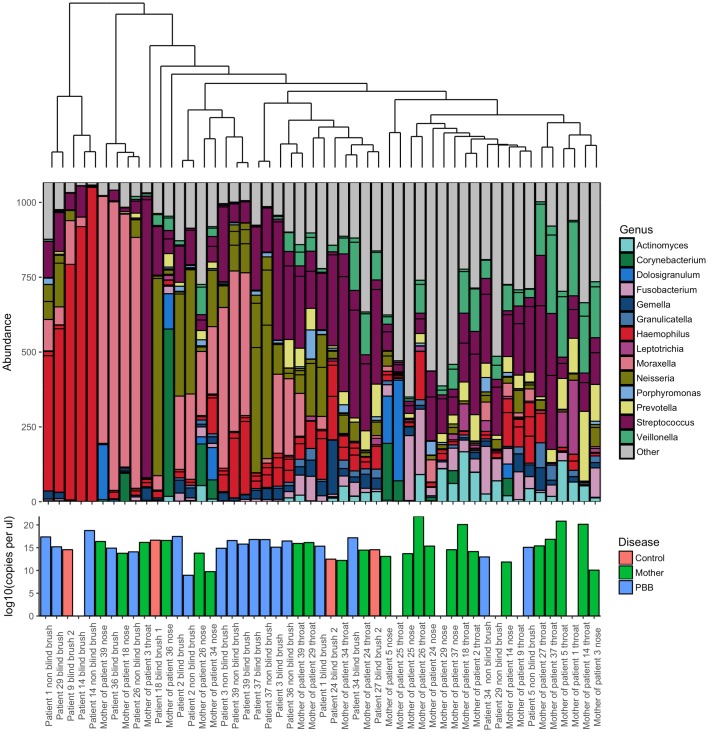
Fig 3. Ordered bar chart of the top 20 OTUs present in both the mother of study children less than 2 years old and their children.
This subgroup includes both healthy children (red) and those diagnosed with PBB (blue). Mothers are indicated in green. Samples are ordered by a Bray Curtis dissimilarity hierarchical cluster, shown above. Key to colours used for each genus is included. Lower bar plot indicates the log10 copies per μl as calculated by qPCR.

