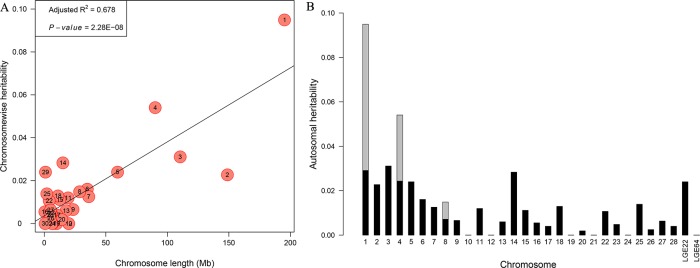
Fig 5. Genome partitioning of OW using a joint analysis.
A. The estimated proportion of variance captured by each chromosome relative to its size. Solid lines are shown for linear regressions. The characters in circles are the chromosome numbers. B. Contributions of the GWAS SNPs partitioned by chromosome. The whole bars indicate the estimates of variance explained by each chromosome, of which the three gray bars represent the same values for the three leading loci.

