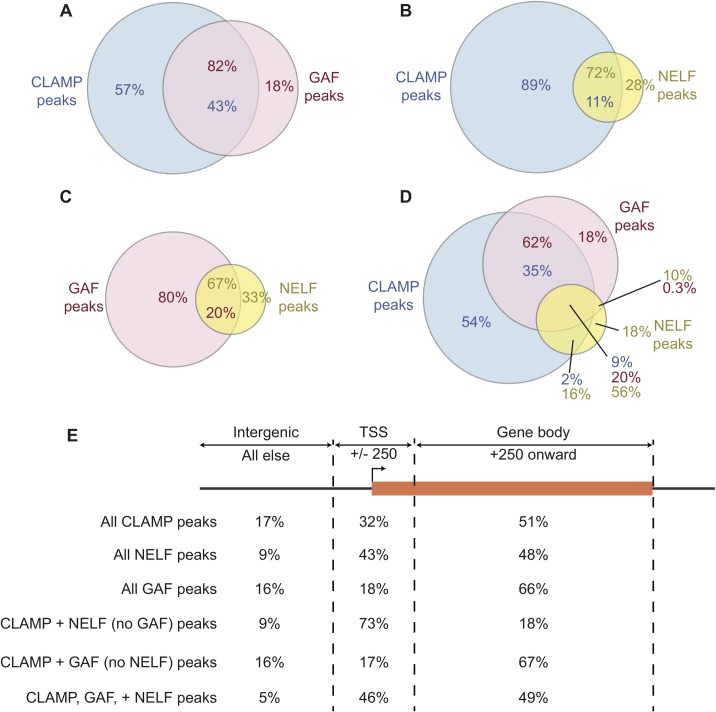
Fig 3. Overlap and distribution relative to genes of CLAMP, GAF, and NELF ChIP-seq occupancy.
Comparison of CLAMP and GAF ChIP-seq peaks with NELF-B ChIP-chip peaks was performed to determine the overlap between factor occupancy. The numbers in dark green represent the percentage of CLAMP peaks, dark red are the percentage of GAF peaks, and dark blue are the percentage of NELF peaks. (A) Only 43% of CLAMP peaks overlap with GAF, whereas the majority (82%) of GAF peaks overlap with CLAMP. (B) A small fraction (11%) of CLAMP peaks overlap with NELF, while most NELF peaks also contain CLAMP (72%). (C) Fewer NELF peaks (67%) associate with GAF than with CLAMP (72%). (D) Venn diagram describes the percentage of CLAMP, GAF, and NELF peaks that overlap with each of the other factors. (E) CLAMP, GAF, and NELF peaks were categorized as either within +/- 250bp centered on the transcription start site (TSS), between +250bp and the end of the gene (gene body), or intergenic (all other peaks). The percentages of total CLAMP, GAF, or NELF peaks that fall within each of these regions are in the first three rows. Next, the distribution of CLAMP peaks that are also occupied by NELF, GAF, or both is shown in the last three rows.

