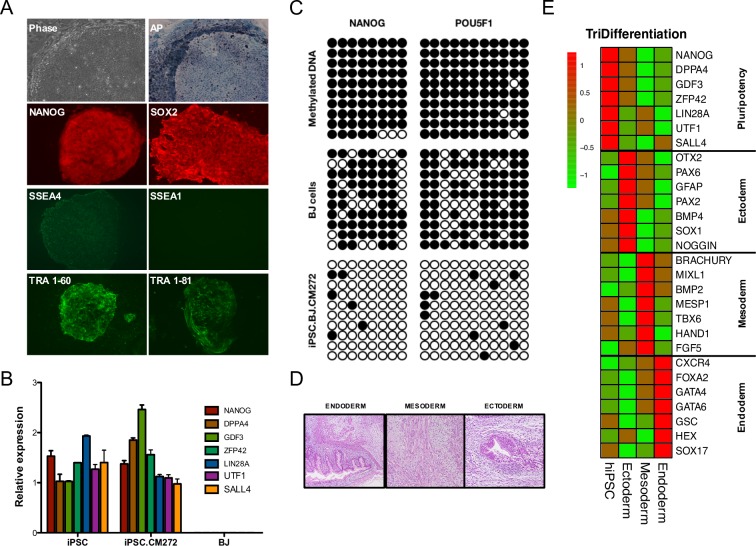
Fig 3. iPSCs resemble pluripotent features.
(A) Representative images of the characteristic morphology of pluripotent cells, AP+ staining and immunofluorescence of indicated pluripotency markers in a stablished iPSC cell line generated in the presence of CM272. (B) Expression levels measured by qPCR of indicated pluripotency-associated genes in a stablished iPSC cell line generated in the presence of CM272. Error bars denote SD of three independent measurements. (C) Bisulfite sequencing of NANOG and POU5F1 (OCT4) promoter regions in a stablished iPSC cell line generated in the presence of CM272. BJ cells and methylated DNA were used as controls. (D) Hematoxylin and eosin staining shows a teratoma from an iPSC cell line generated in the presence of CM272 containing multiple tissues, including tissues from the three germ layers (ectoderm, endoderm and mesoderm). Results for other iPSC lines are summarized in S3 Table. (E) Heatmap showing principal pluripotency and lineage specific markers differentially expressed in iPSC after trilineage differentiation.

