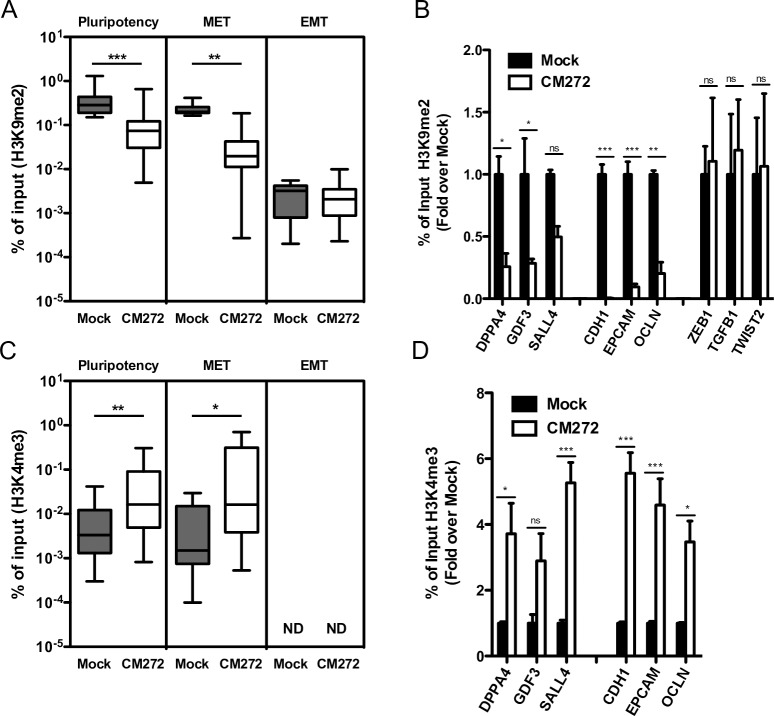
Fig 6. Analysis of H3K9me2 and H3K4me3 levels after CM272 treatment.
ChIP-qPCR at different promoter regions of pluripotency and MET associated genes. (A and B) H3K9me2 ChIP-qPCR analysis in CM272-treated cells before OSKM induction. (C and D) H3K4me3 ChIP-qPCR analysis in CM272-treated cells 5 days after OSKM induction. Means and SD of three independent experiments are represented. ND: not-determined. Two-way ANOVA with Bonferroni post-tests to compare replicate means was used. * p<0.05, ** p<0.01, *** p<0.001, ns: not significative.

