
Figure 2.
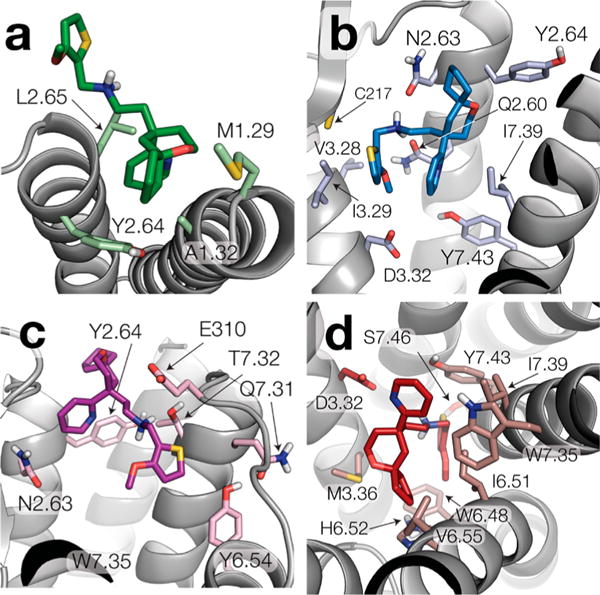
Representative structures of the clusters with the largest spatial distribution of the center of mass of TRV-130 at each MOR location. Specifically, panels a–d show ligand–receptor interactions of representative structures of clusters 2, 3, 5, and 10, respectively.