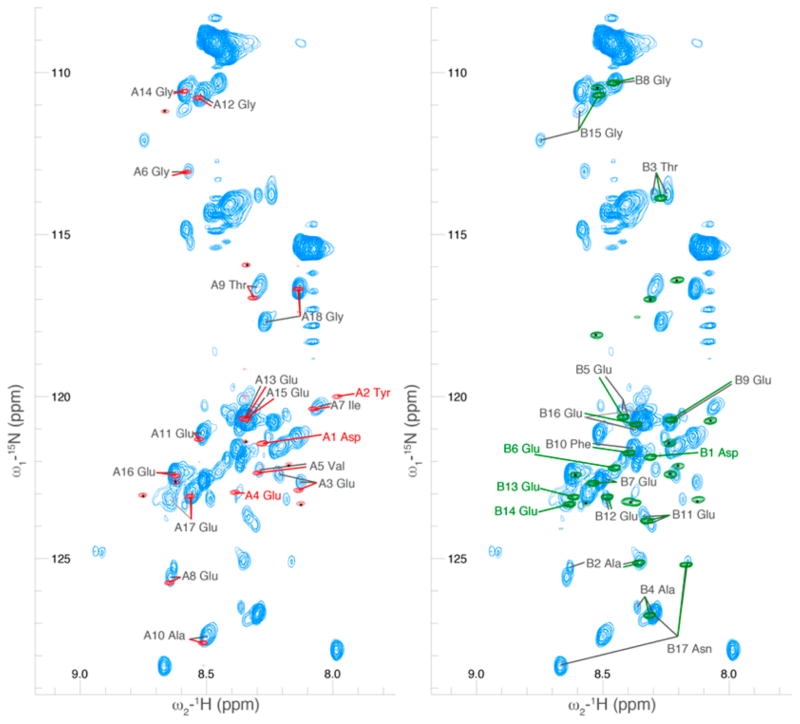
Figure 5.
A comparison of the 2D projection of a 3D HCNO spectrum of the C-terminal tails of tubulin in the context of the full TOG-purified dimer as compared to bacterially produced GST-fusion peptides of the C-terminal tail sequences. The spectrum of the GST-α fusion peptide is shown in red, overlaid with the tubulin spectrum; similarly, the spectrum of the GST-β fusion peptide is shown in green, overlaid with the tubulin spectrum. Significant differences between the tubulin and peptide spectrum could be due to the presence of post-translational modification on our endogenous tubulin samples or due to interactions of the C-terminal tails with the rest of the tubulin dimer. As the majority of our endogenous sample was unmodified, we expect interactions with the rest of the dimer played the dominant role. Peaks with a small black asterisk have been assigned to the linker region between the peptides and GST and thus do not overlay with the C-terminal tails.

