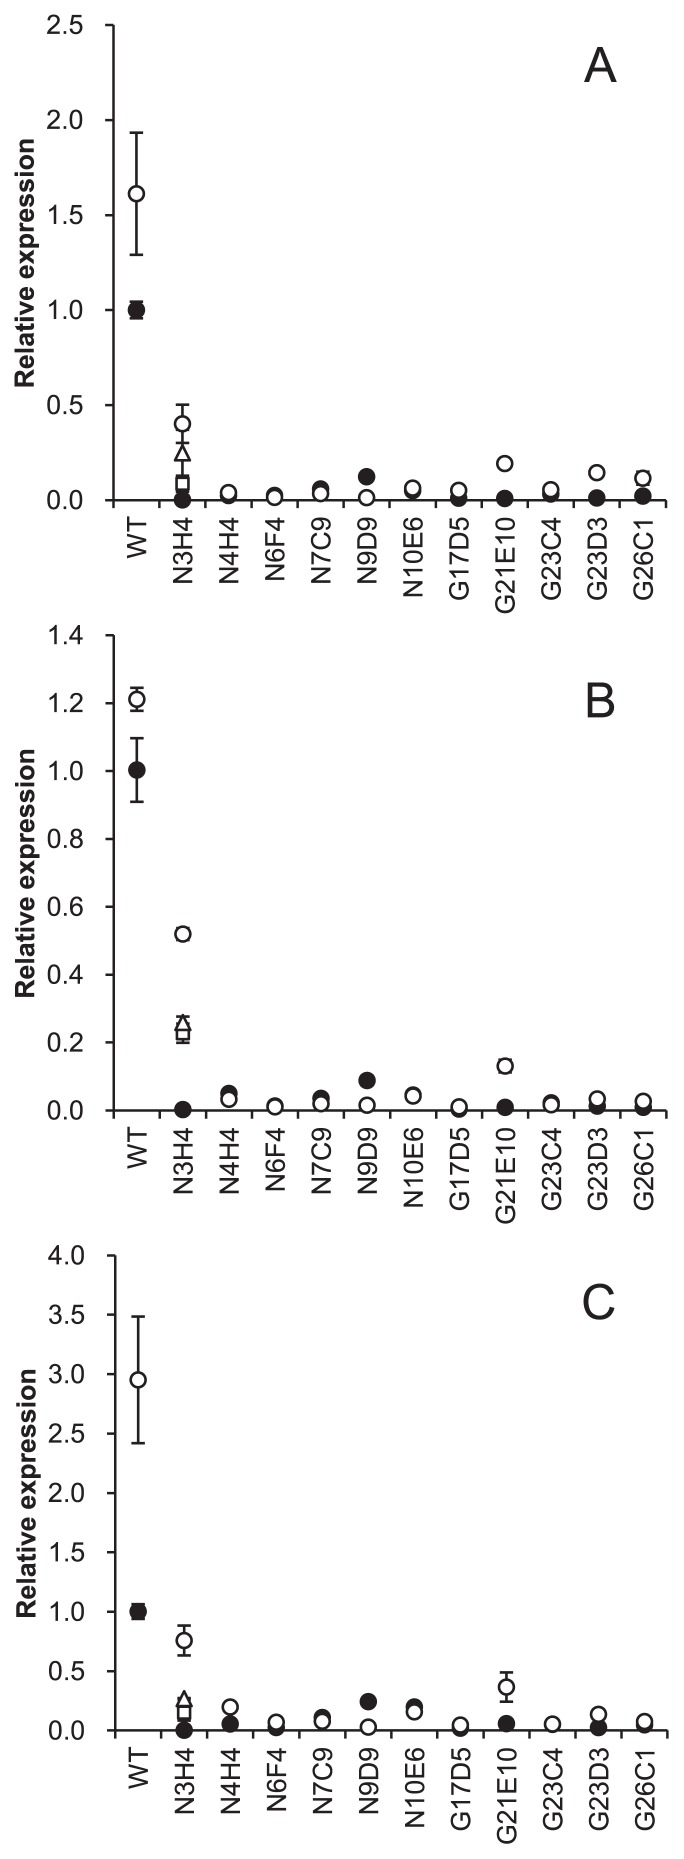
Fig. 4.
Expression of transcripts of nifE (A), nifH (B), and nifV (C). Relative levels to a value obtained from the wild-type (WT) sample are shown. Two to four RNA samples from different cultures were tested for each strain and results from the same RNA are indicated by the same symbol. The bar represents the standard deviation of 3 technical replicates.

