
Figure 1. LD and haplotype maps of the CFH locus in this Spanish population.
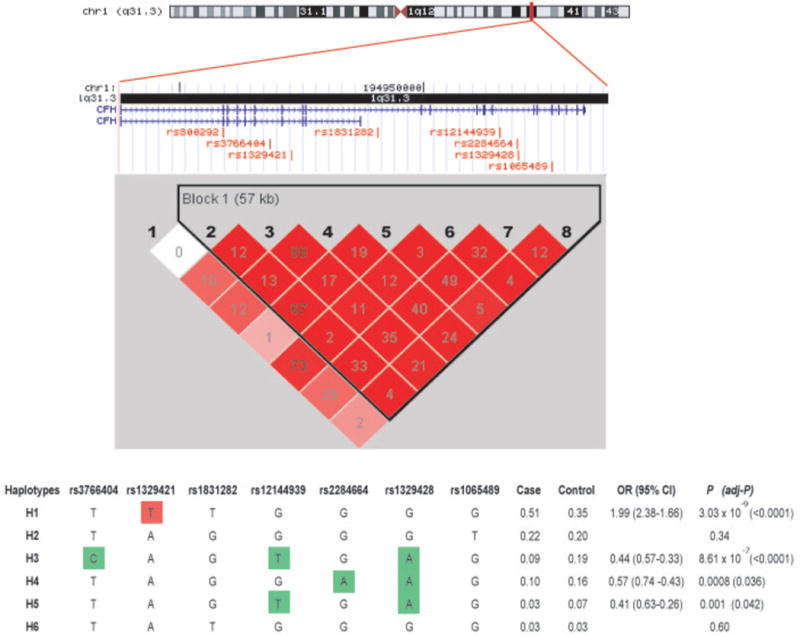
A schematic representation of the intron/exon structure of the CFH gene is indicated above the LD plot. Relative positions of studied SNPs are also indicated. Each box provides r2 values with darker red shades representing stronger LD. Haplotype association analysis in cases and controls were performed for the single haplotype block found at this locus. All of the haplotypes with a frequency of >1% are displayed. The estimated frequencies of the haplotype in cases and controls, ORs, 95% CI and P-values are also shown. The risk haplotype (H1) is shown in red shading, and the protective haplotypes (H3, H4 and H5) are shown in green shading. Alleles exclusively found in these risk and protective haplotypes are boxed.