
Figure 2. LD and haplotype maps of the FGF2 locus in this Spanish population.
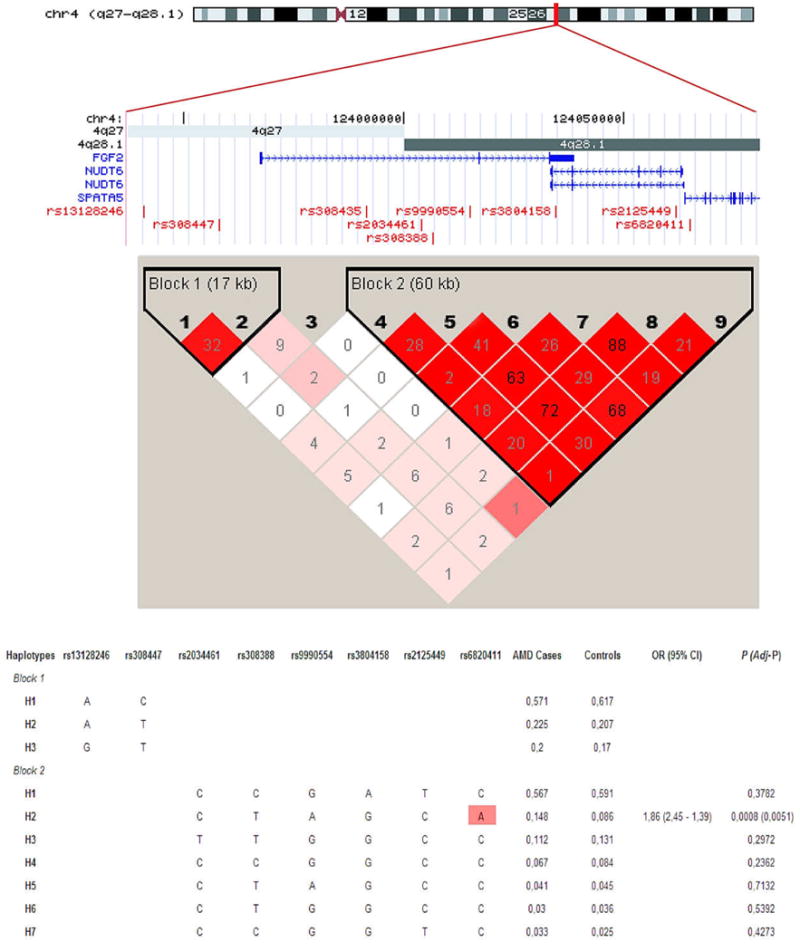
A schematic representation of the intron/exon structure of the FGF2 and NUDT6 genes with the relative positions of tagSNPs, is indicated above the LD plot. Each box provides r2 values with darker red shades representing stronger LD. Haplotype association analysis in cases and controls are also performed on the two haplotype blocks found at this locus. All of the haplotypes with a frequency of >1% are displayed. The estimated haplotypic frequencies in cases and controls, P-values, ORs and 95% CI are also shown. The risk haplotype (H3) is shown in red shading remarking in a box the risk allele at rs6820411.