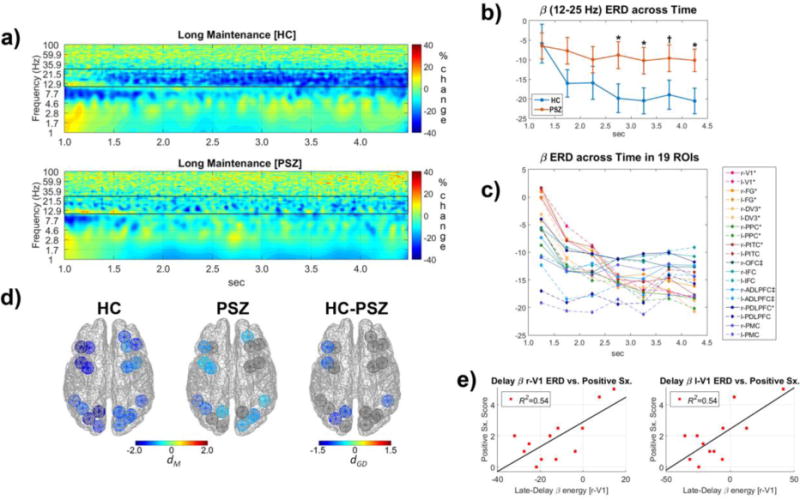
Figure 3. Cortical oscillatory activity during the maintenance of the model object in working memory.

Panels depict TF oscillatory energy during the maintenance of material in WM over a long-delay period from 1.0 to 4.5 seconds (i.e., period after the disappearance of model object stimulus). a) Grand average TF energy of cortical oscillatory energy in HCs (top) and PSZ (bottom) averaged across ROIs and complexity conditions and normalized to represent percent signal change compared to the median TF energy for each frequency within a pre-stimulus baseline (−500-0 ms relative to the model stimulus onset). Black rectangular outlines highlight frequencies of interest quantified for statistical analyses (β: 12–25 Hz). b) Reduction in β oscillations in the HCs (top) during maintenance of material in WM was largely absent in PSZ (bottom). Examination of the interaction of group and time for β oscillation decreases (i.e., ERD) across seven .5 sec time-intervals revealed smaller β ERD in PSZ, particularly in the late portion of the maintenance period (* = p<.05 and † = .05<p<.10) (2.5–3.0 sec: F(1,23)=4.75, p=.04; 3.0–3.5 sec: F(1,23)=4.63, p=.04; 3.5–4.0 sec: F(1,23)=3.37, p=.08; 4.0–4.5 sec: F(1,23)=5.60 p=.03). c) Time course of β oscillations mean energy across seven .5 sec intervals in the WM-related 19 ROIs. Regions with a significant (p<.05) linear decrease across time are marked with *, and those with a significant quadratic decrease (i.e., an early decrease followed by a leveling off at the end of the delay) are marked with ‡. Select visual, parietal, and prefrontal cortical regions exhibited greater β ERD over the course of the delay period. d) Cortical regions where late-delay β ERD (11–25 Hz in 2.5–4.5 sec) was most evident in HCs (left) and PSZ (middle), as well as group differences in the β oscillatory energy (right). e) Scatterplots depicting a linear relationship between positive psychotic symptomatology and the late-delay β ERD for primary visual cortex (r-V1 and l-V1 ROIs). PSZ who had more positive psychotic symptoms tended to show less late delay β ERD (i.e., greater β energy).
