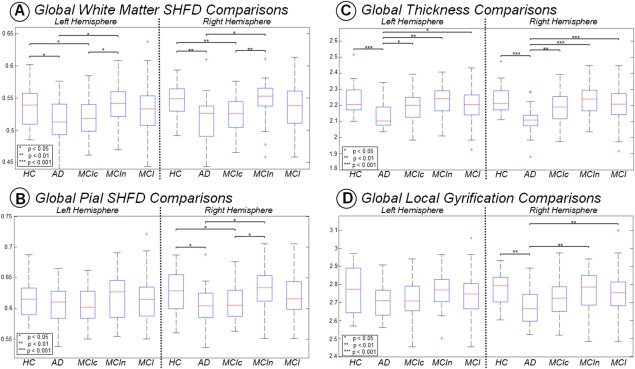
Figure 3.

Boxplot with differences between groups for each hemisphere in Global SHFD ‐ white (A), Global SHFD ‐ pial (B), average thickness (C), and average LGI (D). P values correspond to ANCOVA analyzes with age as covariate. Only P values below 0.05 are displayed. [Color figure can be viewed at http://wileyonlinelibrary.com]
