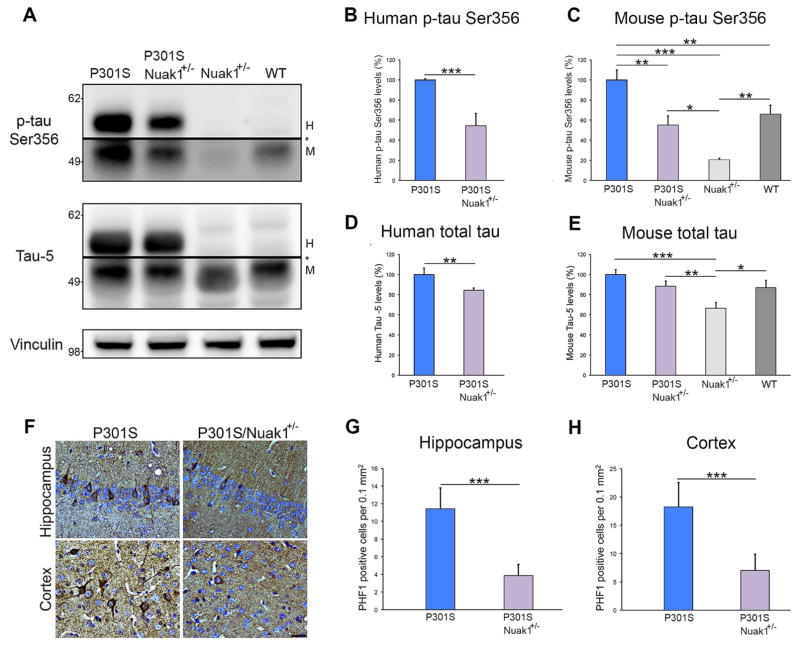
Figure 5. Nuak1 down-regulation prevents tau accumulation and NFT formation in P301S mice.
A) Western blot analysis of brain homogenates from four different genotypes. H=human tau, M=mouse tau. * indicated change in exposure of the membrane. B) Graph showing western blot quantification of human p-tau Ser356 levels. C) Graph showing western blot quantification of endogenous mouse p-tau Ser356 levels. D) Graph showing western blot quantification of total human tau measured with tau-5 antibody. E) Graph showing western blot quantification of endogenous mouse total tau levels. F) PHF1 immunostaining of hippocampal and cortex neurons in P301S and P301S/Nuak1+/− sections. Scale bar 25 μm. G) Graph showing immunostaining quantification of PHF1 positive neurons in the hippocampus. H) Graph showing immunostaining quantification of PHF1 positive neurons in the cortex. For all experiments, n=8, mean ± s.d.m. *p<0.05, **p<0.01 and ***p<0.001. For western blot quantification we utilized ANOVA followed by Bonferroni’s post hoc test. For staining quantification Student’s T-test was utilized. See also Figures S6C–S6G.

