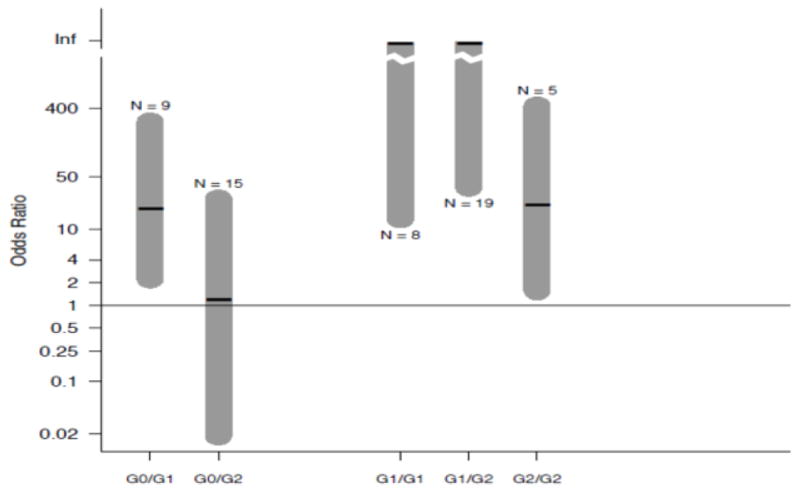
Figure 1. Effect of APOL1 in NIH and South African cohorts.

Shown are the odds ratios for APOL1 and HIVAN in South Africa. On the right are the associations with two APOL1 risk alleles. On the left are the associations with one risk APOL1 risk allele. Even with small sample size, an effect can be seen for a single copy of the G1 allele but not for the G2 allele, even though sample sizes were similar. Used with permission (Kasembeli et al. 2015).
