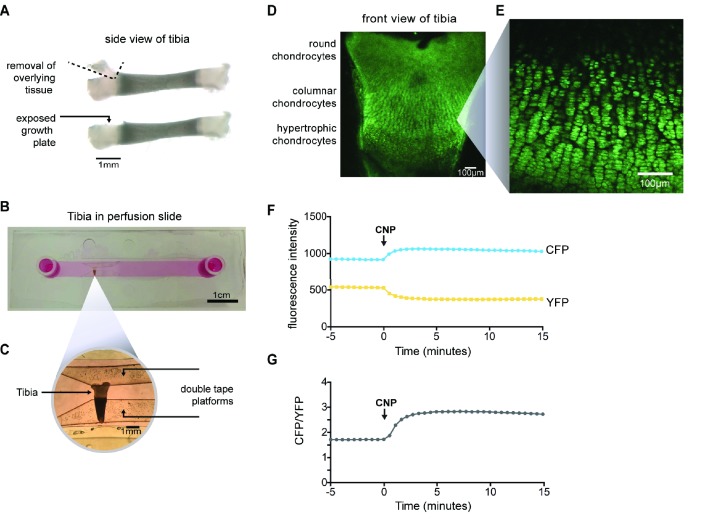
Figure 3. Imaging of CNP-stimulated cGMP production in chondrocytes within intact growth plates.
(A) Preparation of a tibia from a newborn mouse expressing the cGi500 sensor for cGMP. (B) Tibia in a perfusion slide in which medium could be flowed across the growth plate surface while imaging. (C) Higher magnification image of the tibia in the perfusion slide. (D) Confocal image of fluorescence of the entire growth plate. (E) Higher magnification image of the columnar/prehypertrophic region that was used for measurements of cGMP (from a different tibia from that shown in D). (F,G) Time courses of CFP and YFP emission intensities and the CFP/YFP ratio, before and after perfusion of 100 nM CNP.

