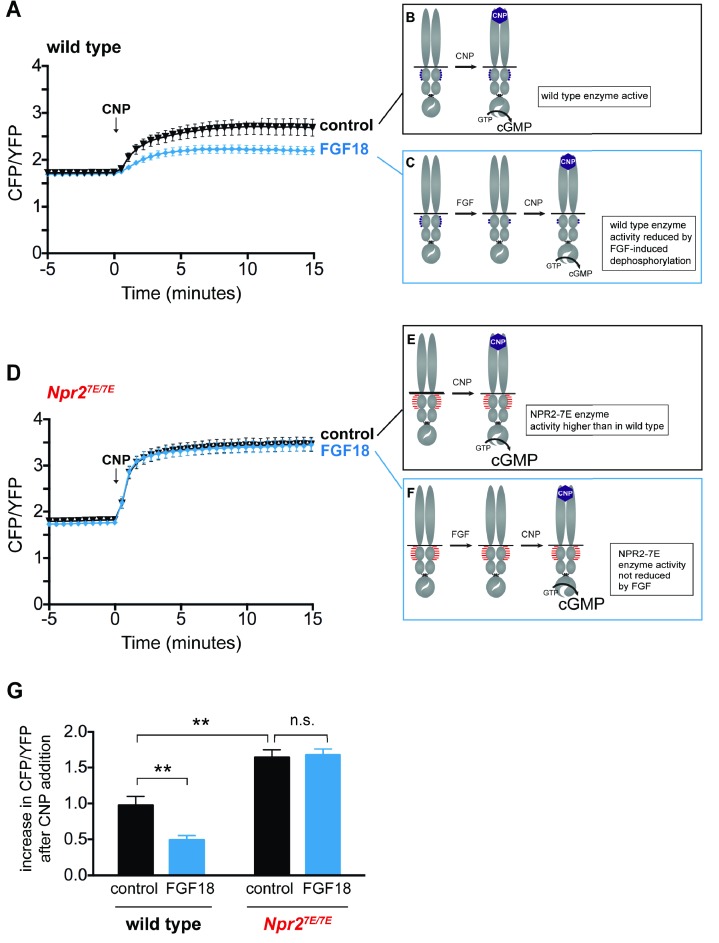
Figure 4. FGF reduces NPR2 guanylyl cyclase activity in growth plate chondrocytes from wild type mice, but not in those from Npr27E/7E mice.
Experiments were performed using tibias dissected from newborn mice (day 0–1) and used for imaging over the next 2 days. (A) Time course of CFP/YFP intensity ratios after 100 nM CNP was perfused across a wild type growth plate, comparing tibias that were preincubated for 80–140 min with a control solution (1 µg/ml heparin) (n = 11) or with FGF18 (0.5 μg/ml FGF18 +1 µg/ml heparin) (n = 14). CNP was present for the remainder of the recording period. An increase in the CFP/YFP ratio in response to CNP indicates cGMP production by NPR2. This and other graphs show mean ±s.e.m. (B,C) Schematic diagrams depicting the dephosphorylation of NPR2 in response to FGF, as demonstrated in rat chondrosarcoma cells (Robinson et al., 2017), and the effect on NPR2 guanylyl cyclase activity, in wild type tibia. Without FGF treatment, the seven regulatory serines and threonines on each monomer are mostly phosphorylated (depicted by five purple dots). After FGF treatment, the regulatory sites are mostly dephosphorylated (depicted by two purple dots). (D) Time course of CFP/YFP intensity ratios after 100 nM CNP was perfused across an Npr27E/7E growth plate, comparing tibias that were preincubated for 80–140 min with a control solution (1 µg/ml heparin) (n = 10) or with FGF18 (0.5 μg/ml FGF18 +1 µg/ml heparin) (n = 11). (E,F) Schematic diagrams depicting NPR2 with seven glutamates on each monomer (indicated by seven red lines) and the lack of effect of FGF on NPR2 enzyme activity. (G) Increases in CFP/YFP ratios after CNP perfusion, comparing data from wild type tibias with and without FGF pretreatment (from A) and data from Npr27E/7E tibias with and without FGF pretreatment (from D). Values were determined by subtracting the mean CFP/YFP ratio 0–5 min before CNP perfusion from the mean ratio 10–15 min after CNP perfusion. Data were analyzed by unpaired t-tests, with the Holm-Sidak correction for multiple comparisons. T-tests rather than ANOVA were used because we were only interested in a subset of comparisons that tested specific hypotheses. **p≤0.01.
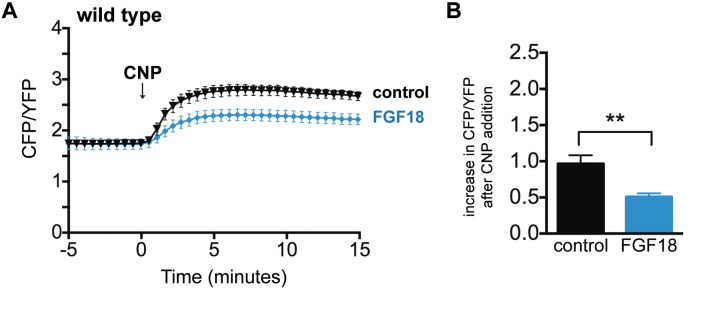
Figure 4—figure supplement 1. Inhibition of NPR2 activity by a 30–50 min preincubation with FGF.
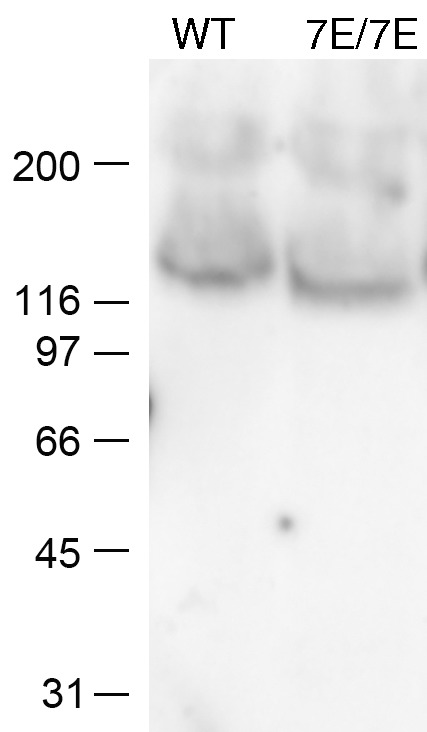
Figure 4—figure supplement 2. Western blot showing that wild type and Npr27E/7E epiphyses contain similar amounts of NPR2 protein (25 μg total protein loaded per lane).


