. 2017 Dec 14;6:e29750. doi: 10.7554/eLife.29750

Figure 1. cAMP induces 5hmC in cells.

(A) Dot-blot shows that treatment with ascorbate (50 μM) for 3 days or cAMP (100 μM) for 7 days induced 5hmC in Schwann cells. (B) Semi-quantification of the dot-blot shows that both cAMP and ascorbate enhanced 5hmC generation in Schwann cells. (C) cAMP (10–250 μM) increased 5hmC in Schwann cells after 7 days treatment shown by IF. (D) IF quantification indicates the dose-dependent effect of cAMP on 5hmC in Schwann cells. (E) cAMP (100 μM) treatment for 1–7 days increased 5hmC in Schwann cells. (F) IF quantification shows that the effects of cAMP treatment from 1 to 7 days induces comparable effects on 5hmC in Schwann cells. (G) Endogenous cAMP promotes 5hmC in Schwann cells. AMP (100 μM) treatment for 2 days did not induce 5hmC while AC activators (forskolin (100 μM), bicarbonate (50 mM)), and PDE inhibitors (caffeine (100 μM), IBMX (100 μM)) enhanced 5hmC generation. (H) IF quantification indicates that forskolin, bicarbonate, caffeine and IBMX increase 5hmC in Schwann cells. *p<0.0005. Scale bar = 20 μm (n = 3 independent experiments with three biological replicates in each group, error bars denote standard deviation).

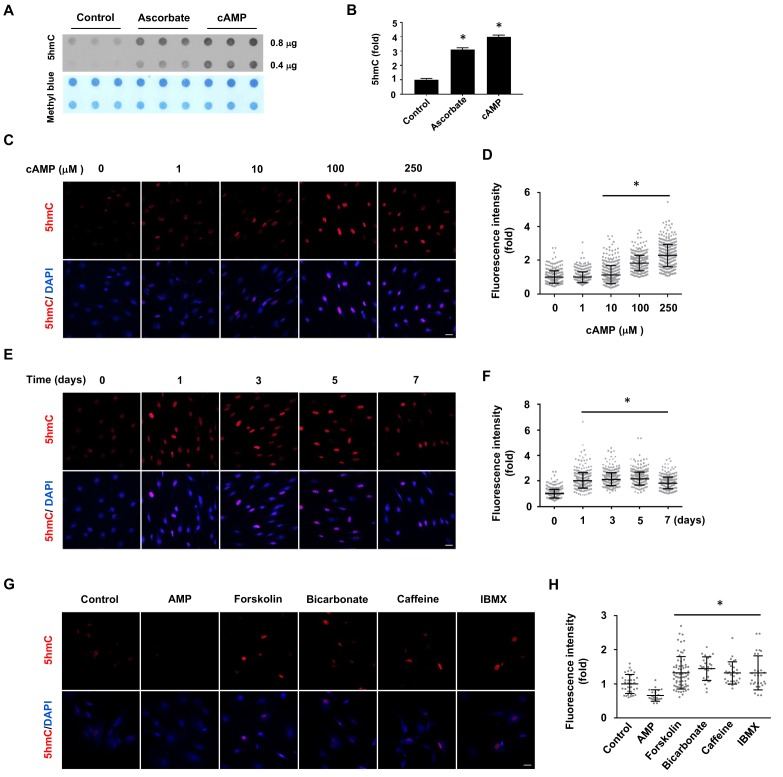
Figure 1—source data 1. Primers used for quantitative RT-PCR.
DOI: 10.7554/eLife.29750.007

Figure 1.

Figure 1—figure supplement 1. cAMP induces 5hmC in different cell types.

Figure 1—figure supplement 1.

cAMP (10 μM) induced 5hmC in HEK-293 cells, MEF, and SH-SY5Y cells after treatment for 8 hr. Scale bar = 20 μm.
Figure 1—figure supplement 2. 5hmC elevation by shorter treatment of forskolin in Schwann cells.

Figure 1—figure supplement 2.

(A) Schwann cells were treated with forskolin (10 μM) for 3 hr followed by washout. 5hmC induction was detected at of 0, 3, and 24 hr time points following treatment. Cells continuously treated with forskolin (5, 10 μM) for 24 hr showed comparable 5hmC levels. Scale bar = 20 μm. (B) IF quantification indicate elevated 5hmC by forskolin treatments. (C) Schwann cells were treated with forskolin (10 μM) for 4, 12, or 24 hr followed by washout. 5hmC induction was then detected 72 hr following treatment. The elevated 5hmC was at similar levels in cells continuously treated with forskolin for 72 hr. Scale bar = 10 μm. (D) IF quantification indicate the elevated 5hmC by forskolin treatments. *p<0.0005. Scale bar = 20 μm (n = 2 independent experiments with three biological replicates in each group, error bars denote standard deviation).
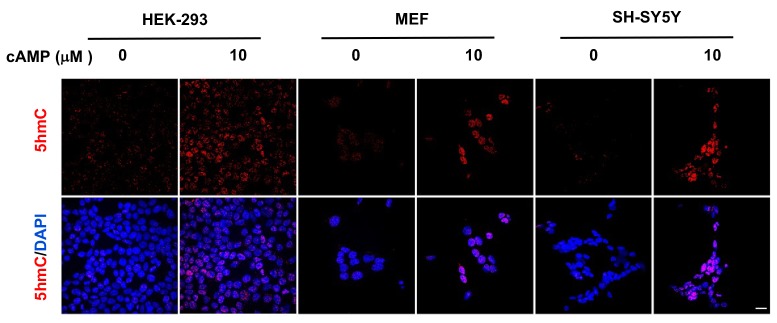
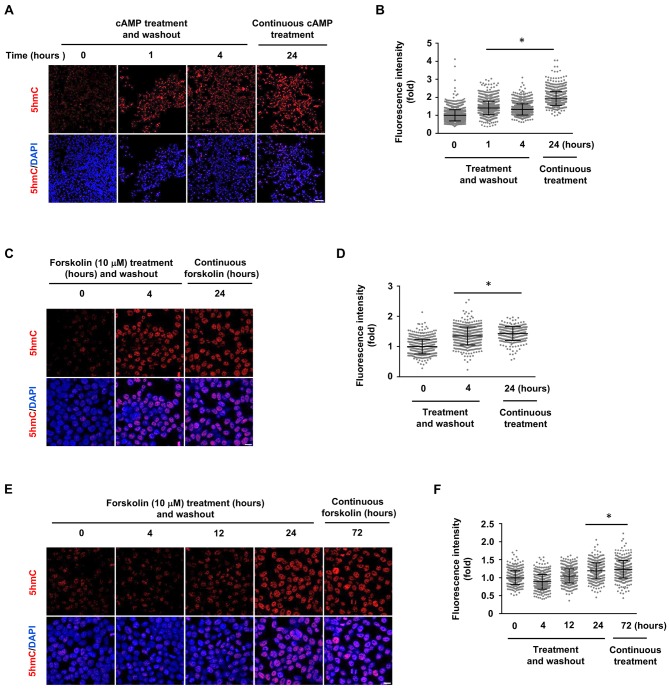
Figure 1—figure supplement 3. 5hmC elevation by shorter treatment of cAMP and forskolin in HEK-293 cells.

Figure 1—figure supplement 3.

(A) HEK-293 cells were treated with cAMP (10 μM) for 1 or 4 hr followed by washout. 5hmC was detected at the time point of 24 hr, which is at a level comparable to the continuous treatment (24 hr). Scale bar = 100 μm. (B) IF quantification shows the 5hmC elevation by cAMP. (C) HEK-293 cells were treated with forskolin (10 μM) for 4 hr followed by washout. 5hmC induction was detected at the 24 hr time point following treatment, which is comparable to the cells treated continuously with forskolin for 24 hr. Scale bar = 20 μm. (D) IF quantification indicate elevated 5hmC by forskolin treatments. (E) HEK-293 cells were treated with forskolin (10 μM) for 4, 12 or 24 hr followed by washout. 5hmC induction was then detected 72 hr following treatment. Levels of 5hmC in cells treated for 24 hr followed by washout were comparable to those treated continuously for 72 hr. However, there was no significant difference in 5hmC levels in the 4 or 12 hr treatment and washout groups compared to the controls. Scale bar = 20 μm. (F) IF quantification indicate the elevated 5hmC by forskolin treatments. *p<0.0005. (n = 2 independent experiments with three biological replicates in each group, error bars denote standard deviation).
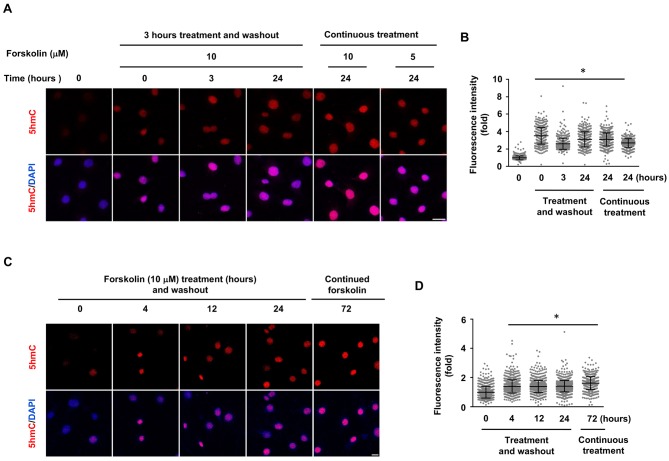
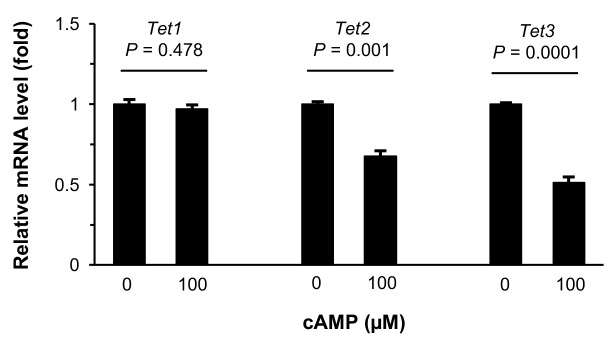
Figure 1—figure supplement 4. Treatment with cAMP does not increase Tet transcripts.

Figure 1—figure supplement 4.

qRT-PCR shows that Tet1 mRNA remained at a similar level (p=0.478) after treatment of Schwann cells with cAMP (100 μM) for 1 day. In contrast, levels of Tet2 mRNA (p=0.001) and Tet3 mRNA (p=0.0001) were decreased after treatment of Schwann cells with cAMP (100 μM) for 1 day (n = 2 independent experiments with three biological replicates, error bars denote standard error).