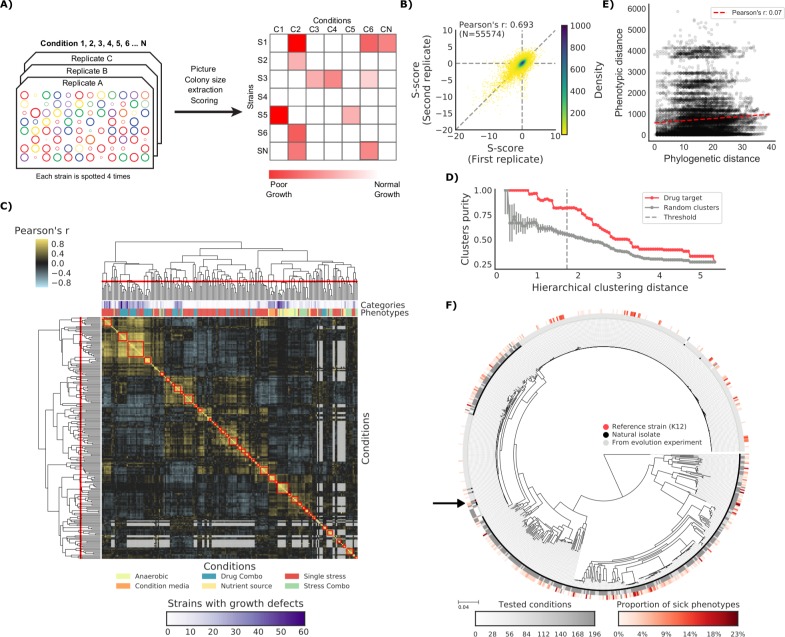
Figure 1. The phenotypic landscape of the E.
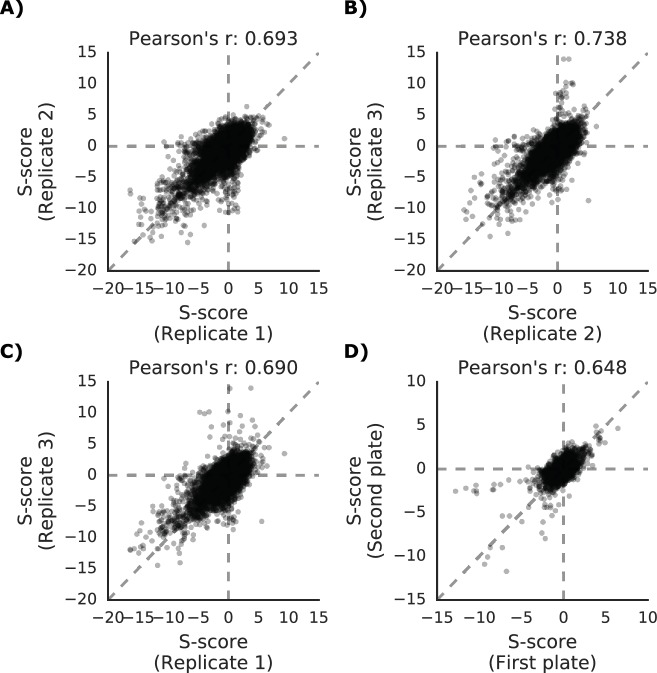
coli strain collection. (A) Phenotypic screening experimental design and data analysis. (B) Phenotypic measurements replicability, as measured by pairwise comparing the S-scores of all three biological replicates. (C) Hierarchical clustering of condition correlation profiles; the threshold is defined as the furthest distance at which the minimum average Pearson’s correlation inside each cluster is above 0.3. The two colored bands on top indicate the number of strains with growth defects for each condition and its category, showing consistent clustering. Gray-colored cells in the matrix represent missing values due to poor overlap of strains tested in the two conditions. (D) Clusters purity (computed for drug targets) for each hierarchical distance threshold, against that of random clusters (100 repetitions) shows that drugs with similar target tend to cluster together. (E) Pearson’s correlation between phylogenetic and phenotypic distances, based on phylogenetic independent contrasts (see Materials and methods). (F) Core genome SNP tree for all strains in the collection. Grey shades in the inner ring indicate the number of conditions tested for each strain, red shades in the outer ring indicate the proportion of tested conditions in which the strain shows a significant growth defect. The black arrow indicates the reference strain.


