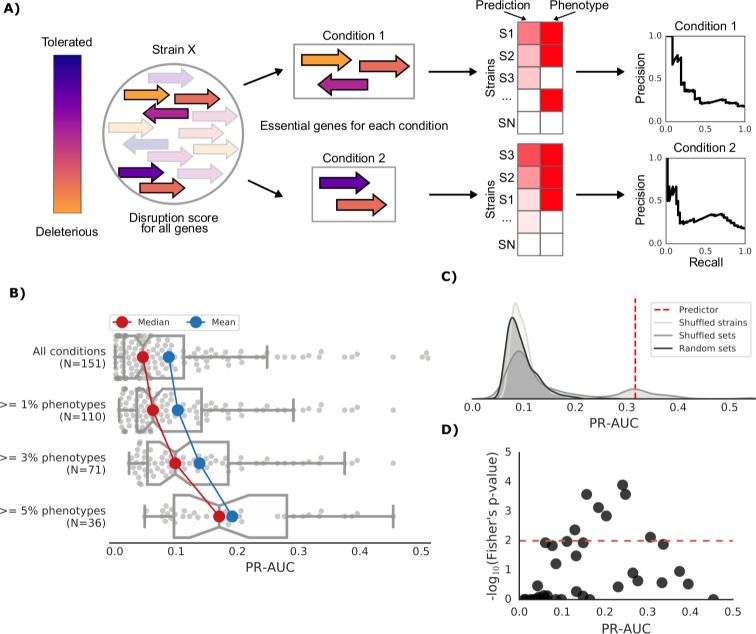
Figure 3. Prediction of growth-defect phenotypes in the E.coli strain collection.
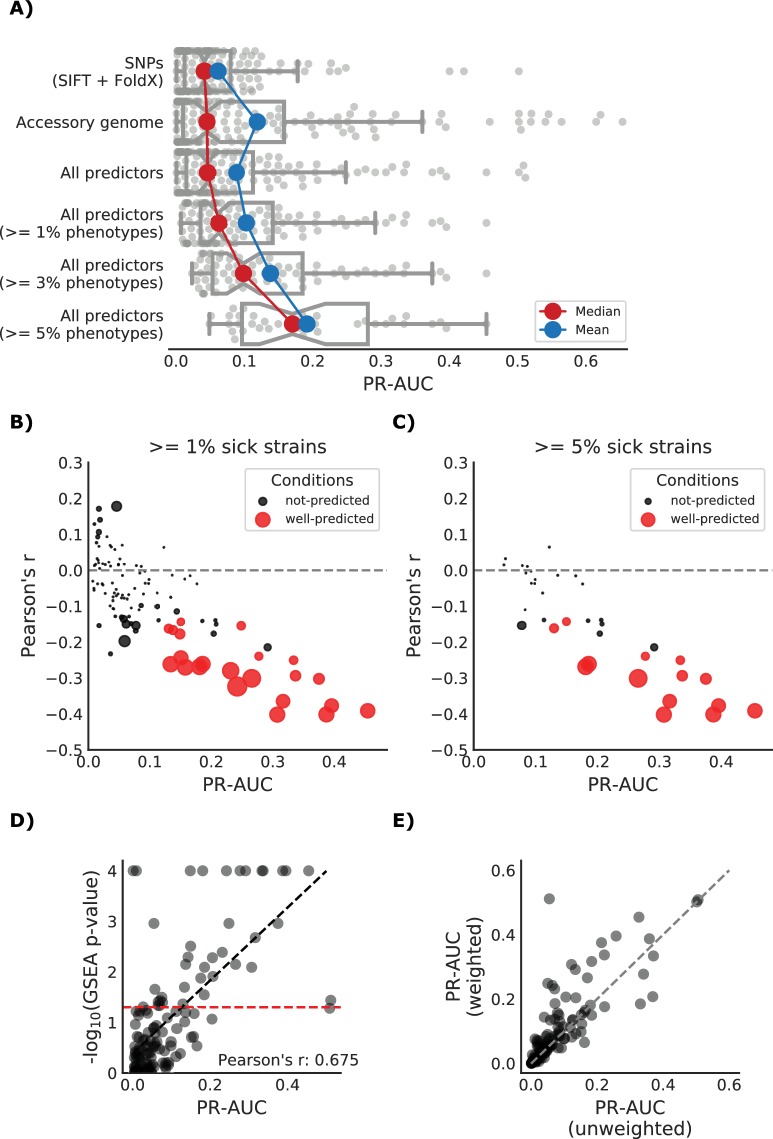
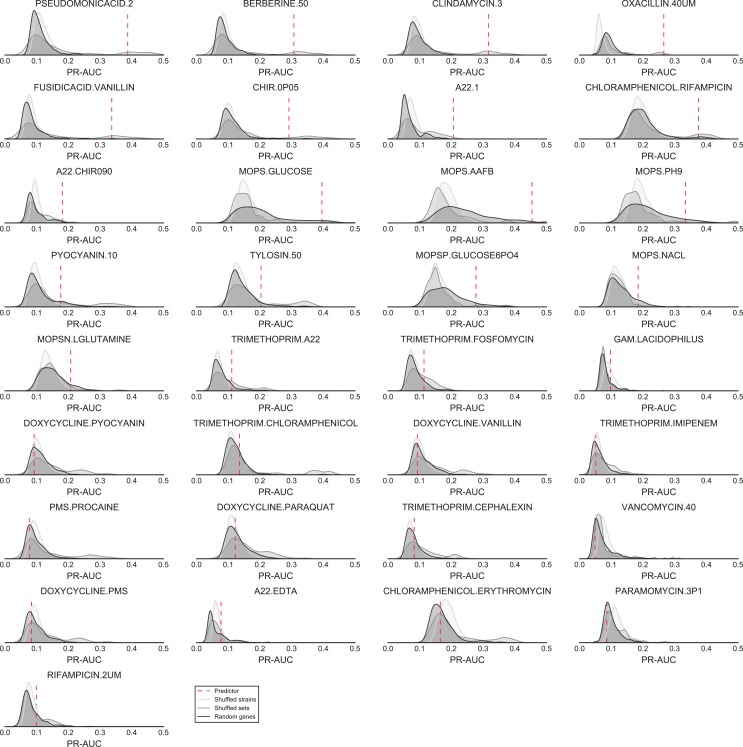
(A) Schematic representation of the computation of the prediction score and its evaluation; for each condition the predicted score is computed using the disruption score of the conditionally essential genes. The score is then evaluated against the actual phenotypes through a Precision-Recall curve. (B) Higher predictive power for conditions with higher proportion of growth phenotypes. For each condition set, the PR-AUC value for each condition is reported, together with the median and mean value (C) Significance of the PR-AUC value reported for the condition ‘Clindamycin 3 μg/ml’, against the distribution of three randomization strategies. ‘Shuffled strains’ indicates a prediction in which the actual strains’ phenotypes have been shuffled; ‘shuffled sets’ indicates a prediction where the conditionally essential genes of a different condition have been used, and ‘random set’ indicates a prediction where a random gene set has been used as conditionally essential genes. For all three randomizations we report a significant difference between the actual prediction and the distribution of the randomizations (q-values of 1E-30, 0.05 and 1E-22, respectively). See Figure 3—figure supplement 2 for the other conditions. (D) Genome-wide gene associations are in agreement with the predictive score; the enrichment of conditionally essential genes in the results of the gene association analysis is significantly higher in conditions with higher PR-AUC.


