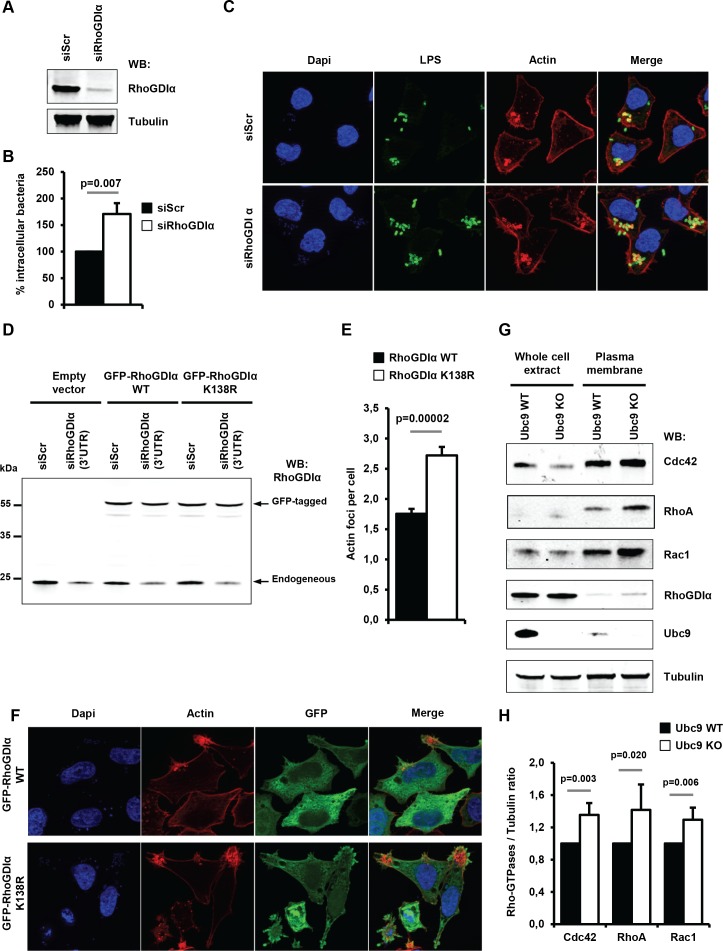
Figure 6. Sumoylation of RhoGDIα regulates Shigella internalization in epithelial cells.
(A) HeLa cells were treated with siRNA for RhoGDIα or a control siRNA (siScr). Immunoblot analysis was performed using anti-RhoGDIα and -tubulin antibodies. (B) Percentage of Shigella internalization upon siRNA-mediated knockdown of RhoGDIα relative to control siRNA. The percentage of internalized bacteria was quantified using the gentamicin protection assay (taken siScr value as 100%) 30 min post-infection. Each value is the mean of eleven independent experiments ± SEM. (C) Representative images of Shigella-induced actin foci in siRNA-treated HeLa cells after 10 min infection. Samples were processed for bacterial LPS (green), actin (red) and nuclei (blue) staining. (D) Hela cells co-transfected with siRhoGDIα (targeting the 3’UTR) together with either GFP-tagged sRhoGDIα WT or GFP-tagged RhoGDIα K138R. Immunoblotting was performed using a RhoGDIα antibody. Arrows indicate GFP-tagged and endogenous RhoGDIα proteins. (E) Hela cells co-transfected as in D and infected with M90T for 10 min. Samples were fixed and processed for actin staining 10 min post-infection. The average number of actin foci per cell ±s.d. is indicated (n = 4, at least 50 cells counted per condition). (F) Representative images of Shigella-induced actin foci in HeLa cells co-transfected as in D with GFP-tagged RhoGDIα constructs (green) after 10 min infection. Samples were processed for actin (red) and nuclei (blue) staining. (G) Immunoblot analysis was performed on whole-cell lysates or plasma membrane fractions (recovered by ultracentrifugation) from Ubc9 WT or Ubc9 KO MEFs using anti-Cdc42, -RhoA, -Rac1, - RhoGDIα, -UBC9 and -tubulin antibodies. (H) Quantification of the immunoblot signals obtained from Ubc9 WT or Ubc9 KO MEF protein extracts are presented as RhoGTPase signal (Cdc42, RhoA or Rac1, as indicated on the x-axis) relative to tubulin signal (mean of five independent experiments ± s.d.).


