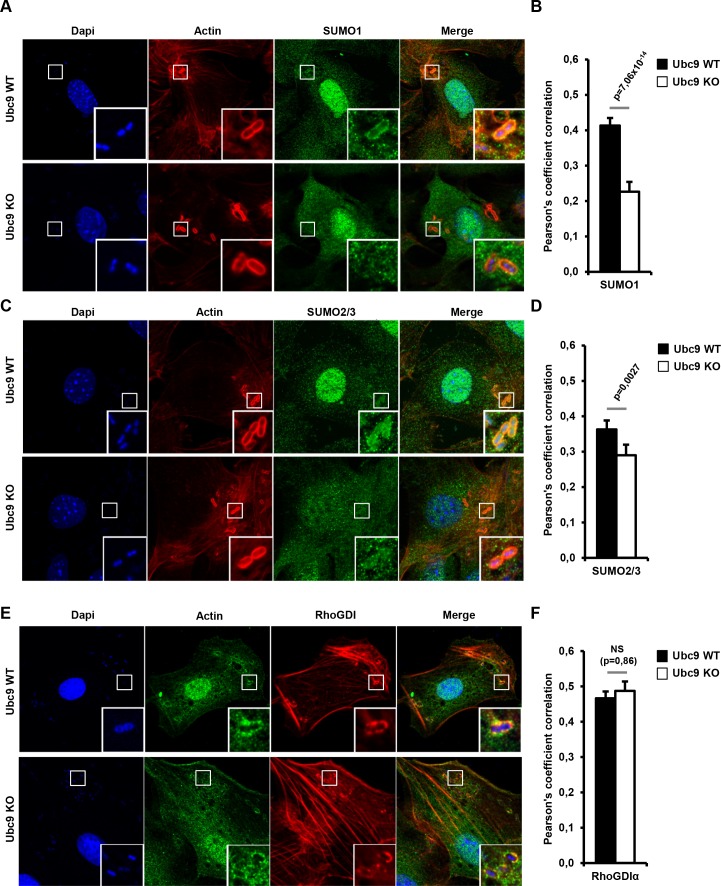
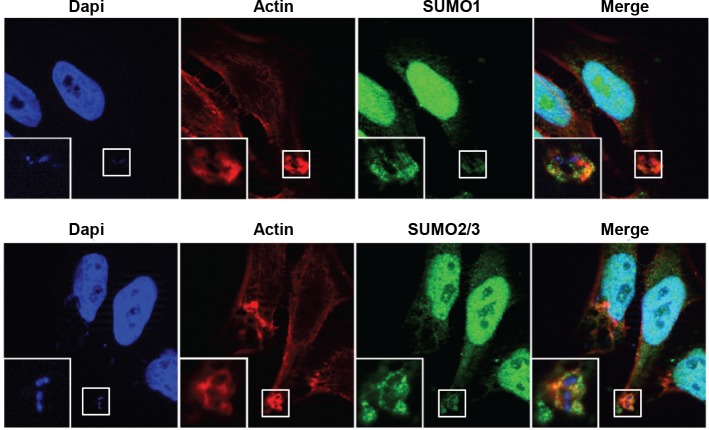
Figure 7. Endogenous RhoGDIα and SUMO are localized at Shigella-induced actin foci.
(A) SUMO1 accumulates at Shigella (M90T) entry sites. Representative ApoTome-generated micrographs of Shigella-infected Ubc9 WT or Ubc9 KO MEFs after 10 min infection. Samples were fixed and processed for immunostaining using anti-SUMO1 antibody (green) and staining of actin (red) and nuclei (blue) (white square, inset). (B) The Pearson’s coefficient (Rr) was used to measure the signal intensity correlation between SUMO1 and Shigella-induced actin foci stainings. Data are means ±SEM (at least 40 foci analyzed per condition). p value calculated as described in Materials and Methods. (C) SUMO2/3 accumulates at Shigella (M90T) entry sites. Same as in A using a SUMO2/3 antibody. (D) Same as in B with SUMO2/3 signal. (E) Recruitment of RhoGDIα is at Shigella (M90T) entry sites. Same as in A using a RhoGDIα antibody. (F) Same as in B with RhoGDIα signal. NS: non significant.


