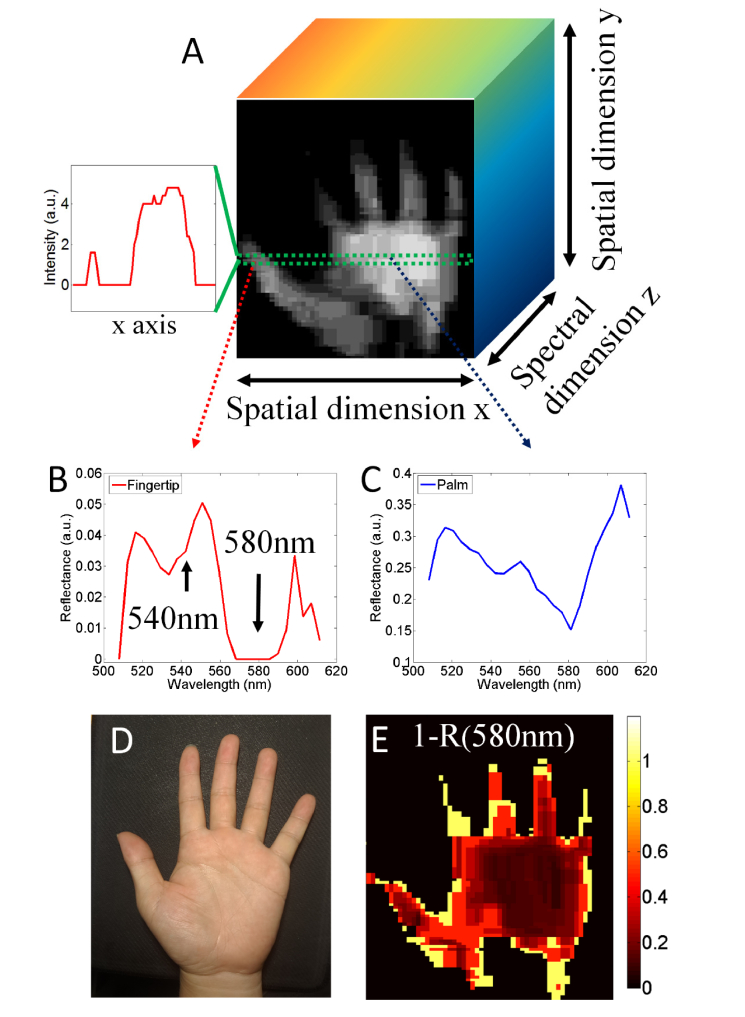
Fig. 4.
(a). Schematic illustration of the 3D spectral image data cube. Herein, the spatial image represents the total reflectance image, see detail in text. The inset show the reflectance intensity line profile denoted by the green dotted rectangle region. (b) and (c) show the reflectance spectra derived from fingertip and palm, respectively; (d). The photo taken during the scanning experiment; (e). The reflected image at the 580 nm band, see more detail in the main text.

