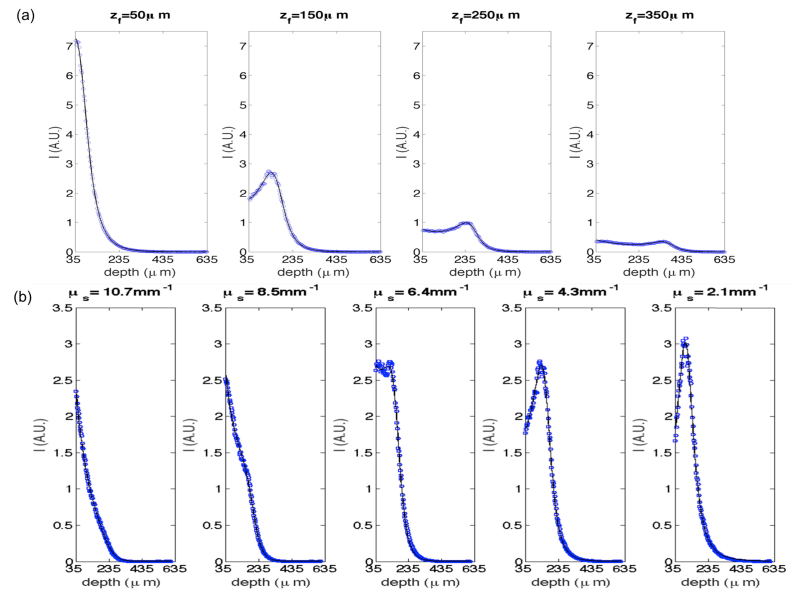
Fig. 2.
Depth profiles of the microsphere phantom at different focus depths (a) and with different concentrations (b). a) = 4.3mm−1, the focus depths at 50 μm, 150 μm, 250 μm and 350 μm, respectively. b) = 150 μm, expected scattering coefficients are 10.7 mm−1, 8.5 mm−1, 6.4 mm−1, 4.3 mm−1, and 2.1 mm−1, respectively. The dashed blue curves are averaged depth-profile from 5000 A-lines, and the solid black curves are the fitting functions.

