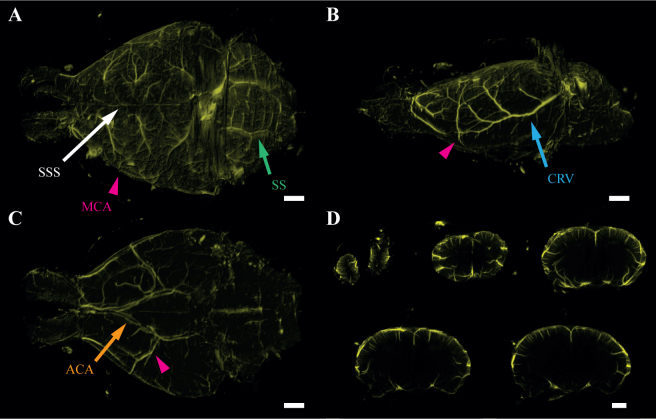
Fig. 4.
Visualization of the brain vasculature in a 4-month-old B6SJL F1 mouse. The brain was perfused with an FITC-albumin hydrogel and imaged with OPT. 3D rendering from the top (A), side (B), and bottom (C) view (see Visualization 2 (15.4MB, avi) ). Maximum intensity projections of 20 coronal sections through the whole brain (D) showing the penetrating venules/arterioles. ACA, anterior cerebral artery; CRV, caudal rhinal vein; MCA, middle cerebral artery; SS, sigmoid sinus; SSS, superior sagittal sinus. Scale bars: 1 mm.

