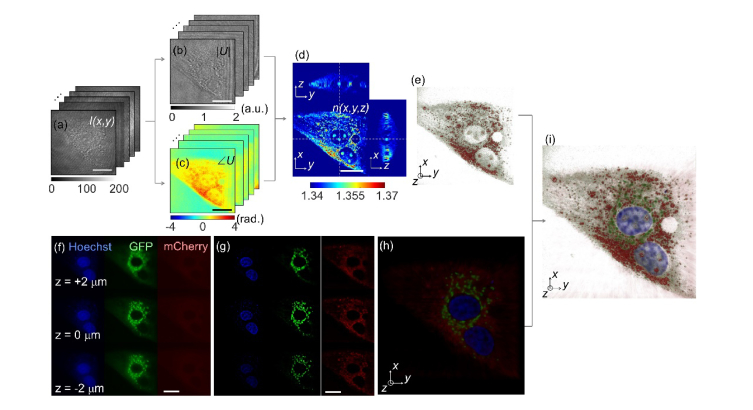
Fig. 2.
A schematic diagram of the ODT reconstruction (a-e) and correlative microscopy with 3D fluorescence imaging (f-h). (a) Raw holograms of an NIH-3T3 cell obtained with various illumination angles. (b) Amplitude and (c) phase map of the complex optical fields of the cell. (d) The cross-sectional slices and (e) the 3D rendered map of the reconstructed 3D RI distribution of the sample. (f) Axially stacked three-channel epi-fluorescence images of the same cell. (g) The fluorescence images of the cell after 3D deconvolution. (h) The fluorescence image merged with three-channel deconvoluted fluorescence images. (i) The 3D rendered map of the 3D RI distribution and three-channel fluorescence images for correlative analysis. Scale bar indicates 20 μm.

