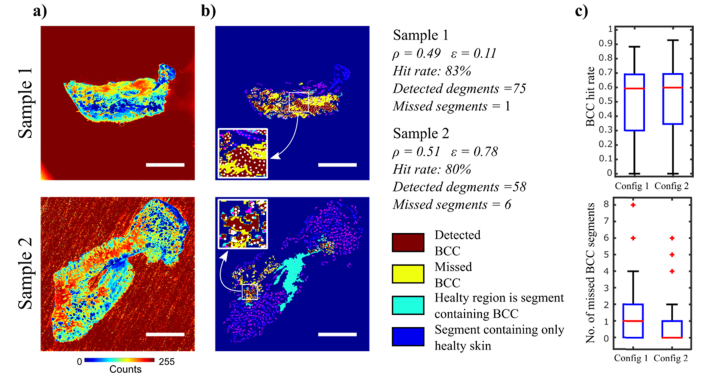
Fig. 3.
Evaluation of sampling points for Raman spectroscopy based on segmentation of AF images (Config. 2). Sample 1: typical sample containing BCC, Sample 2: the sample with the highest number of segments with BCC missed by the allocated sampling points. a) AF images; b) segmented images and sampling points using uniform distribution: pink points represent Raman measurements performed on healthy tissue and white points represent Raman measurements performed on BCC. The number of segments containing BCC detected and missed are indicated for each sample; Scale bars: 5mm. c) evaluation of tumour “Hit rate” and missed segments for: sampling points allocated selectively: sampling point at the position of the lowest and highest intensity within each segment, and uniform distribution of the remaining sampling points (Config. 1); sampling points distributed uniformly within segments (Config. 2).

